PNC to acquire FirstBank for $4.1B, expanding presence in Colorado and Arizona
- PNC Financial Services Group Inc (NYSE:PNC) announced a definitive agreement to acquire Colorado-based FirstBank Holding Company, including its banking subsidiary FirstBank, in a $4.1 billion deal. The acquisition will expand PNC's footprint in Colorado and Arizona, adding to its retail and commercial banking presence in these fast-growing markets.
- 09/08/2025
|
PNC Financial to buy smaller rival FirstBank in $4.1 billion deal
- U.S. bank PNC Financial said on Monday it will buy Colorado-based FirstBank Holding in a $4.1 billion cash-and-stock deal.
- 09/08/2025
|
The market will continue higher, but expect September to be choppy, says PNC's Yung-Yu Ma
- Yung-Yu Ma, PNC Asset Management chief investment strategist, joins 'Money Movers' to discuss his market outlook amid weak job data and tariff uncertainty.
- 09/05/2025
|
The PNC Financial Services Group Announces Third Quarter Conference Call Details
- PITTSBURGH , Sept. 3, 2025 /PRNewswire/ -- The PNC Financial Services Group, Inc. (NYSE: PNC) expects to issue financial results for the third quarter 2025 at approximately 6:30 a.m.
- 09/03/2025
|
Top 10 High-Yield Dividend Stocks For September 2025
- My watchlist outperformed SPY and VYM since July 1st, offering higher yield and competitive total returns, despite trailing benchmarks year-to-date. The strategy focuses on high-quality, attractively valued, high-yield stocks, aiming for a long-term CAGR of 12% and strong dividend growth. Since inception, the watchlist achieved a 15.61% CAGR and an 83.5% success rate in positive returns, validating the stock selection process.
- 08/31/2025
|
Large Cap Dividend-Paying Banks Exploding Higher on Rate Cut Hopes
- One very positive item for investors when earnings season rolls around every quarter is that the big money center and investment banks are always among the first to report.
- 08/29/2025
|
PNC Bank Survey Offers Insights, Analysis on Financial Wellness Mindset Among U.S. Workers and Employers
- The survey reveals that benefits built for multigenerational workers can help them prepare for the future they envision. PITTSBURGH , Aug. 27, 2025 /PRNewswire/ -- PNC Bank today released findings from its third annual Financial Wellness in the Workplace Report entitled, "What today's workers value most, across generations," which summarizes survey data and in-depth interviews from more than 1,000 U.S. workers and more than 500 U.S. employers to better understand the financial health and wellness of today's workforce.
- 08/27/2025
|
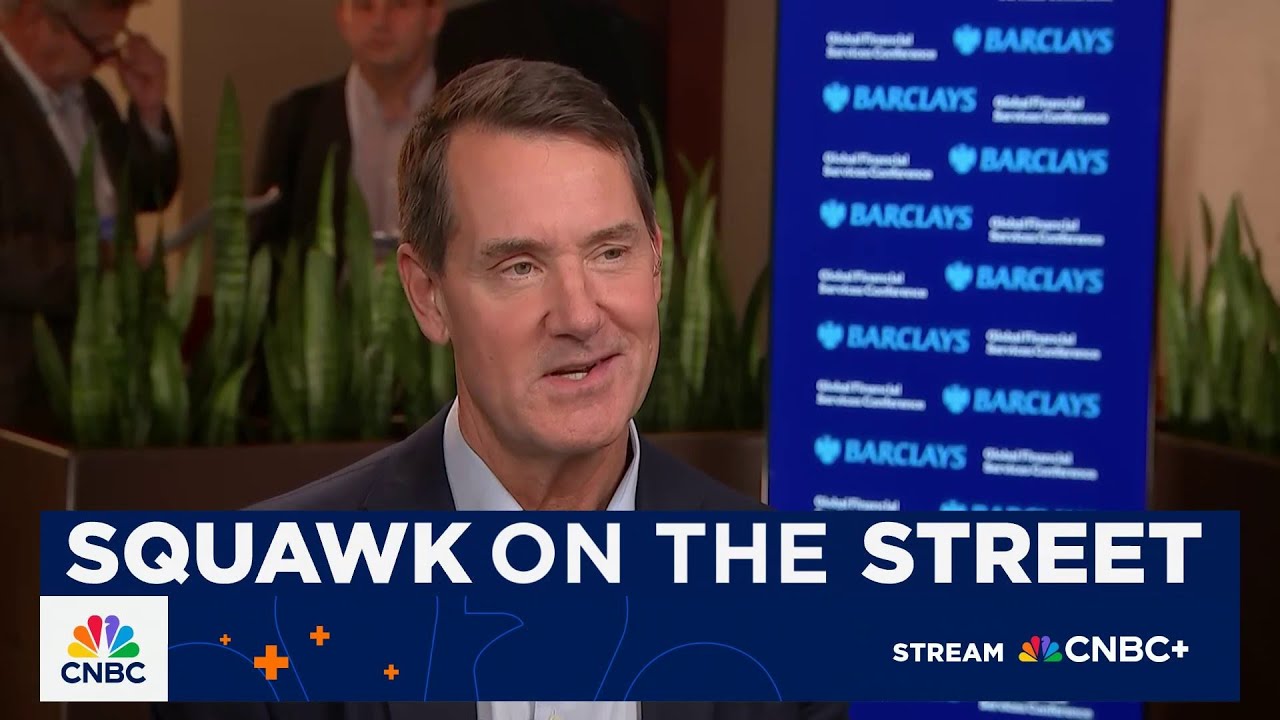
PNC Executives To Speak At Barclays Global Financial Services Conference
- PITTSBURGH , Aug. 26, 2025 /PRNewswire/ -- The PNC Financial Services Group, Inc. (NYSE: PNC) announced today that Chairman and Chief Executive Officer William S. Demchak and Executive Vice President and Chief Financial Officer Robert Q.
- 08/26/2025
|
Why The PNC Financial Services Group, Inc (PNC) is a Great Dividend Stock Right Now
- Dividends are one of the best benefits to being a shareholder, but finding a great dividend stock is no easy task. Does The PNC Financial Services Group (PNC) have what it takes?
- 08/20/2025
|
PNC Bank Announced as Gold Sponsor for the 2025 National Mutt Strut Benefiting Guardian Angels Medical Service Dogs
- Pittsburgh, PA, Aug. 14, 2025 (GLOBE NEWSWIRE) -- Guardian Angels Medical Service Dogs is proud to announce PNC Bank as the Gold Sponsor of the 2025 National Mutt Strut, a virtual event launching on World Mental Health Day, October 10, 2025, and running through October 22, 2025. This inspiring nationwide initiative raises critical awareness and funds to support Guardian Angels' mission of pairing life-saving service dogs with veterans, first responders, and civilians living with invisible disabilities such as PTSD and trauma.
- 08/14/2025
|
New York AG James sues Zelle parent company for alleged fraud
- New York Attorney General Letitia James sued the parent company of payment network Zelle for allegedly enabling fraud. James alleged that the company knew about ongoing fraud between 2017 and 2023 and did not take actionable steps to resolve it.
- 08/13/2025
|
New York sues Zelle, says security lapses led to 'rampant' consumer fraud
- Zelle was sued on Wednesday by New York Attorney General Letitia James, who said the electronic payment platform's refusal to adopt critical safety features enabled fraudsters to steal more than $1 billion from consumers.
- 08/13/2025
|
NCFL, PNC Grow Up Great Team Up to Pilot Outdoor Learning Program for Families
- Let's Learn Together Outside launches this summer in Kentucky and Alabama; Texas planned next year. LOUISVILLE, Ky.
- 08/13/2025
|
MSCI Forges Strategic Collaboration with PNC Bank to Expand Personalized Wealth Management
- NEW YORK--(BUSINESS WIRE)--MSCI Inc. (NYSE: MSCI) and PNC Bank have entered into a strategic collaboration to provide financial advisors of PNC with access to MSCI Wealth Manager – a fully integrated digital platform with robust analytics, portfolio management tools, institutional-grade research and solutions to help advisors create more personalized experiences for end-investors. From high-net-worth and emerging-affluent individuals to large, sophisticated institutional investors, asset and we.
- 08/13/2025
|
The market will continue to bump past minor disruptions, says PNC's Yung-Yu Ma
- Yung-Yu Ma, PNC Asset Management chief investment strategist, joins 'Money Movers' to discuss the market reaction to the latest round of tariff announcements and his outlook for the Fed and economy.
- 08/07/2025
|
The PNC Financial Services Group, Inc (PNC) Could Be a Great Choice
- Dividends are one of the best benefits to being a shareholder, but finding a great dividend stock is no easy task. Does The PNC Financial Services Group (PNC) have what it takes?
- 08/04/2025
|
These 2 Powerhouse Banks Just Declared Dividend Raises, and You Can Still Take Advantage of 1
- It's a good time to be an investor in U.S. banks. Two months or so after the latest round of the Federal Reserve's (Fed) bank stress tests -- in which 22 prominent lenders in the country were put through their paces to judge how they'd fare in adverse economic circumstances -- several have declared dividends recently (after all, every tested bank passed).
- 08/04/2025
|
Bank of America vs. PNC Financial: Which Bank Stock Has More Upside?
- Bank of America BAC and PNC Financial Services PNC are two prominent U.S. banks with broad national reach. BAC leverages its massive scale and diversified financial services, while PNC is distinguished by its prudent growth strategy and targeted regional expansion.
- 07/29/2025
|
PNC Bank Announces Integration with Oracle Fusion Cloud ERP for Embedded Banking
- Connection Enables PNC PINACLE Connect® Clients to Seamlessly Access Treasury Services Within Market-leading Cloud ERP PITTSBURGH , July 29, 2025 /PRNewswire/ -- PNC Bank today announced the integration of its award-winning embedded banking platform, PINACLE Connect®, with Oracle Fusion Cloud Enterprise Resource Planning (ERP). PNC corporate and commercial banking clients now have seamless connectivity to key banking services directly within Oracle Cloud ERP, helping streamline financial operations and enhance overall efficiency.
- 07/29/2025
|
PNC Financial: Limited Upside In 2025
- PNC Financial delivered decent Q2 results, beating earnings and revenue expectations, with solid loan and deposit growth. Despite recent performance, PNC trades near its historical valuation, limiting upside potential, especially as rate cuts loom. The likely Federal Reserve rate cuts in the second half of the year pose a significant risk to PNC's future net interest income.
- 07/27/2025
|
PNC Reports 5% Revenue Gain in Q2
- PNC Financial Services (PNC -0.01%), one of the largest diversified financial institutions in the United States, released its second quarter 2025 earnings on July 16, 2025. The company reported earnings per share of $3.85, which was above analyst expectations of $3.55.
- 07/23/2025
|
PNC taps Coinbase to create crypto trading offering for bank customers
- PNC Bank is working with cryptocurrency exchange Coinbase to offer crypto trading to the bank's customers, the companies said on Tuesday, in a sign that crypto is moving toward becoming increasingly interconnected to mainstream finance.
- 07/22/2025
|
PNC CEO on new partnership with Coinbase
- PNC CEO Bill Demchak said Tuesday that the bank is partnering with Coinbase to enable digital payments, acting as "a wallet, a provider for any coin that any of our clients want to use," without producing its own stablecoin.
- 07/22/2025
|
PNC and Coinbase Partner to Develop Crypto Financial Solutions
- PNC Bank and Coinbase have partnered to develop a solution that will allow the bank's clients to buy, hold and sell cryptocurrencies.
- 07/22/2025
|
PNC CEO on partnership with Coinbase: We'll be a wallet for any coin our clients want to use
- CNBC's Leslie Picker sits down with Bill Demchak, CEO of PNC, to discuss the bank's strategic partnership with Coinbase, how the partnership will be structured, and more.
- 07/22/2025
|
PNC announces strategic partnership with Coinbase
- CNBC's Leslie Picker joins 'Squawk on the Street' with the latest news on PNC's partnership with Coinbase, how banking executives are thinking about stablecoin, and more.
- 07/22/2025
|
PNC Bank, Coinbase Announce Strategic Partnership to Advance Digital Asset Solutions and Expand Banking Services
- PITTSBURGH , July 22, 2025 /PRNewswire/ -- PNC Bank today announced a strategic partnership with Coinbase aimed at expanding access to trusted, secure, and innovative digital asset solutions to PNC's banking clients and institutional investors. PNC will also provide select banking services to Coinbase, reflecting both companies' commitment to a more resilient digital financial system.
- 07/22/2025
|
PNC Financial Vs. U.S. Bancorp: A Dividend Investor's Dilemma
- PNC Financial and U.S. Bancorp are the largest regional banks in the U.S. Both are solid options for dividend growth investors. Both banks reported good Q2 results with stable credit trends. U.S. Bancorp is currently trading at lower valuation multiples, offers a higher total shareholder yield, and has attractive fee income diversification.
- 07/18/2025
|
PNC & AIR are 2 Top Stocks to Watch After Earnings
- In a busy week that included much-anticipated quarterly reports, these standouts among the finance and aerospace sectors shouldn't be overlooked.
- 07/17/2025
|
Are You Looking for a High-Growth Dividend Stock?
- Dividends are one of the best benefits to being a shareholder, but finding a great dividend stock is no easy task. Does The PNC Financial Services Group (PNC) have what it takes?
- 07/17/2025
|
PNC Financial Analysts Increase Their Forecasts After Strong Earnings
- The PNC Financial Services Group, Inc. PNC reported better-than-expected earnings for the second quarter on Wednesday.
- 07/17/2025
|
PNC Financial: Stunning Q2 With Brighter Net Interest Income Outlook (Rating Upgrade)
- I am upgrading PNC Financial from 'hold' to 'buy', due to strong Q2 earnings, robust loan growth, and improved asset quality. PNC raised its net interest income and loan growth guidance for FY 2025, reflecting higher commercial loan utilization and resilient credit quality. Despite shares now being fairly valued after a 30% rally, PNC's fundamentals and capital efficiency justify its current valuation, versus peers.
- 07/17/2025
|
The PNC Financial Services Group, Inc. (PNC) Q2 2025 Earnings Call Transcript
- The PNC Financial Services Group, Inc. (NYSE:PNC ) Q2 2025 Earnings Conference Call July 16, 2025 10:00 AM ET Company Participants Bryan K. Gill - EVP, Director of Investor Relations Robert Q.
- 07/16/2025
|
PNC Financial Q2 Earnings Beat Estimates on NII & Loan Growth
- PNC's Q2 earnings beat estimates, as higher net interest income and loan growth offset weaker fee income and rising credit provisions.
- 07/16/2025
|
PNC Says Growth Markets and ‘Tariff-Related Considerations' Drive Surge in Commercial Loans
- PNC Financial Services Group generated its highest level of new commercial loan production in 10 quarters during the second quarter, PNC Chairman and CEO William S. Demchak said Wednesday (July 16) during the bank's quarterly earnings call.
- 07/16/2025
|
Live: Goldman Sachs (NYSE: GS) & PNC Financial Services (NYSE: PNC) Earnings Coverage
- Live Updates Live Coverage Updates appear automatically as they are published. Goldman Sachs Results Are out 7:54 am by Eric Bleeker Need-to-Know Numbers: Revenue: $14.58 billion (tops estimates of $13.58 billion) EPS: $10.91 (tops estimates of $9.62) Goldman Sachs reported its second quarter 2025 earnings, revealing net revenues of $14.58 billion and net earnings of $3.72 billion. The diluted earnings per share (EPS) for the quarter was $10.91, a notable increase from $8.62 in the same quarter last year, but a decrease from $14.12 in the previous quarter. The firm also announced an increase in its quarterly dividend to $4.00 per common share, effective in the third quarter. The annualized return on average common shareholders’ equity was 12.8% for the quarter. The company’s book value per common share rose by 1.6% during the quarter to $349.74. Despite a slight decline in net revenues compared to the first quarter of 2025, Goldman Sachs showed a strong performance in its Global Banking & Markets division, which saw a 24% increase in net revenues year-over-year. PNC Beats on NII 7:52 am by Eric Bleeker As we highlighted in the prior update, PNC beat on net interest income which is helping fuel its premarket gains. The stock is still up 1.8% in premarket trading. PNC Results 7:50 am by Eric Bleeker PNC Financial Services Group reported a net income of $1.6 billion for Q2 2025, translating to a diluted EPS of $3.85, surpassing the estimated EPS of $3.56. The company experienced a 4% increase in total revenue to $5.7 billion, driven by growth in both noninterest and net interest income. The net interest income rose by 2% to $3.6 billion, supported by loan growth and the repricing of fixed-rate assets. Noninterest income increased by 7% to $2.1 billion, with notable contributions from card and cash management revenue. PNC’s credit quality remained stable, with a provision for credit losses of $254 million. The company also increased its quarterly dividend by 10 cents to $1.70 per share. PNC maintained a strong capital position with a CET1 capital ratio of 10.5%. Still no Goldman Sachs Earnings / PNC Is Up 1.8% Premarket 7:45 am by Eric Bleeker Goldman Sachs has yet to release its earnings but PNC is up 1.8%. The company’s NII came in especially strong which is fueling early gains. How Did Goldman Sachs Perform in Q1? 07/15/2025 7:15 am by Eric Bleeker Here’s a summary of how Goldman Sachs performed in Q1. As we noted below, analysts are expecting $13.581 billion in sales and a normalized EPS of $9.62 this quarter. The Goldman Sachs Group, Inc. Q1’25 Earnings Highlights: • Adj. EPS: $14.12 ; UP +22% YoY • Revenue: $15.06B ; UP +9% YoY • Adj. Gross Margin: 60.6% ; DOWN -30 bps YoY • Net Income: $4.74B ; UP +15% YoY Q1 Segment Performance: • Global Banking & Markets Revenue: $10.71B ; UP +10% YoY • Asset & Wealth Management Revenue: $3.68B ; DOWN -3% YoY • Platform Solutions Revenue: $676M ; DOWN -3% YoY Other Key Q1 Metrics: • Adj. Operating Income: $5.65B ; UP +7% YoY • Adj. Operating Expenses: $9.13B ; UP +5% YoY • Provision for Credit Losses: $287M; DOWN -10% YoY • Effective Tax Rate: 16.1% (vs. 22.4% YoY) • Book Value Per Share: $344.20; UP +2.2% YoY • Common Share Repurchases: 7.1 million shares for $4.36B • Declared Quarterly Dividend Per Common Share: $3.00 • Average Global Core Liquid Assets: $441B CEO Commentary: – David Solomon: “Our strong results this quarter have demonstrated that in times of great uncertainty, clients turn to Goldman Sachs for execution and insight. While we are entering the second quarter with a markedly different operating environment than earlier this year, we remain confident in our ability to continue to support our clients.” Strategic Updates: – The Board approved a share repurchase program authorizing repurchases of up to $40 billion of common stock, reflecting the firm’s commitment to returning capital to shareholders. Earnings season kicked off yesterday with major banks like Wells Fargo (NYSE: WFC) and JPMorgan Chase (NYSE: JPM) reporting. Financial companies are front and center once again this morning. Bank of America (NYSE: BAC), Morgan Stanley (NYSE: MS), and M&T Bank Corporation (NYSE: MTB) are some of the biggest names reporting before the bell. In this live blog, we’ll be analyzing this morning’s earnings release from Goldman Sachs (NYSE: GS) and PNC Financial Services (NYSE: PNC). PNC Financial Services Q2 Expectations Here’s the key figures PNC is expected to post when it reports shortly. All figures are sourced from S&P Capital IQ: Revenue: $5.603 billion EPS (normalized): $3.56 Book Value/Share: $131.19 Net Income (GAAP): $1.423 billion Goldman Sachs Q2 Expectations Revenue: $13.581 billion EPS (normalized): $9.62 Book Value/Share: $348.02 Net Income (GAAP): $3.119 billion Conference Call Times Both Goldman Sachs and PNC Financial Services will host conference calls after their earnings release. Goldman Sachs conference call is expected to begin at about 9:30 a.m. ET. PNC Financial Services conference call is expected to start at 10:00 a.m. ET. The post Live: Goldman Sachs (NYSE: GS) & PNC Financial Services (NYSE: PNC) Earnings Coverage appeared first on 24/7 Wall St..
- 07/16/2025
|
The PNC Financial Services Group (PNC) Reports Q2 Earnings: What Key Metrics Have to Say
- The headline numbers for The PNC Financial Services Group (PNC) give insight into how the company performed in the quarter ended June 2025, but it may be worthwhile to compare some of its key metrics to Wall Street estimates and the year-ago actuals.
- 07/16/2025
|
PNC Financial's quarterly profit rises on higher interest income, fees
- U.S. bank PNC Financial reported an 11.2% rise in second-quarter profit on Wednesday, aided by higher interest and fee income.
- 07/16/2025
|
PNC Reports Second Quarter 2025 Net Income of $1.6 Billion, $3.85 Diluted EPS
- Strong loan growth; 4% positive operating leverage; stable credit quality Quarterly common stock dividend increased 10 cents to $1.70 per share on July 3, 2025 PITTSBURGH , July 16, 2025 /PRNewswire/ -- The PNC Financial Services Group, Inc. (NYSE: PNC) today reported: For the quarter In millions, except per share data and as noted 2Q25 1Q25 2Q24 Second Quarter Highlights Financial Results Comparisons reflect 2Q25 vs. 1Q25 Net interest income (NII) $ 3,555 $ 3,476 $ 3,302 Income Statement ▪ Generated 4% positive operating leverage; PPNR increased 10% ▪ Revenue increased 4% – NII increased 2%; NIM expanded 2 bps to 2.80% – Fee income increased 3% – Other noninterest income of $212 million ▪ Noninterest expense was stable – Efficiency ratio improved to 60% Balance Sheet ▪ Average loans increased $6.1 billion, or 2%, driven by 4% growth in commercial and industrial loans ▪ Average deposits grew $2.3 billion ▪ Net loan charge-offs were $198 million, or 0.25% annualized to average loans ▪ AOCI improved $0.6 billion to negative $4.7 billion ▪ TBV per share increased 4% to $103.96 ▪ Maintained strong capital position – CET1 capital ratio of 10.5% – Returned $1 billion of capital through common dividends and share repurchases – Strong Federal Reserve stress test results; Stress capital buffer will remain at the regulatory minimum of 2.5% Fee income (non-GAAP) 1,894 1,839 1,777 Other noninterest income 212 137 332 Noninterest income 2,106 1,976 2,109 Revenue 5,661 5,452 5,411 Noninterest expense 3,383 3,387 3,357 Pretax, pre-provision earnings (PPNR) (non-GAAP) 2,278 2,065 2,054 Provision for credit losses 254 219 235 Net income 1,643 1,499 1,477 Per Common Share Diluted earnings per share (EPS) $ 3.85 $ 3.51 $ 3.39 Average diluted common shares outstanding 397 398 400 Book value 131.61 127.98 116.70 Tangible book value (TBV) (non-GAAP) 103.96 100.40 89.12 Balance Sheet & Credit Quality Average loans In billions $ 322.8 $ 316.6 $ 319.9 Average securities In billions 141.9 142.2 141.3 Average deposits In billions 423.0 420.6 417.2 Accumulated other comprehensive income (loss) (AOCI) In billions (4.7) (5.2) (7.4) Net loan charge-offs 198 205 262 Allowance for credit losses to total loans 1.62 % 1.64 % 1.67 % Selected Ratios Return on average common shareholders' equity 12.20 % 11.60 % 12.16 % Return on average assets 1.17 1.09 1.05 Net interest margin (NIM) (non-GAAP) 2.80 2.78 2.60 Noninterest income to total revenue 37 36 39 Efficiency 60 62 62 Effective tax rate 18.8 18.8 18.8 Common equity Tier 1 (CET1) capital ratio 10.5 10.6 10.2 See non-GAAP financial measures in the Consolidated Financial Highlights accompanying this release.
- 07/16/2025
|
Rise in NII & Fee Income to Aid PNC Financial's Q2 Earnings
- PNC's second-quarter results are likely to reflect the benefits of a rise in net interest income and fee revenues, offsetting expense pressure.
- 07/11/2025
|
PNC Earnings Are Imminent; These Most Accurate Analysts Revise Forecasts Ahead Of Earnings Call
- The PNC Financial Services Group, Inc. PNC will release earnings results for the second quarter, before the opening bell on Wednesday, July 16.
- 07/11/2025
|
The PNC Financial Services Group (PNC) Q2 Earnings Preview: What You Should Know Beyond the Headline Estimates
- Besides Wall Street's top-and-bottom-line estimates for The PNC Financial Services Group (PNC), review projections for some of its key metrics to gain a deeper understanding of how the company might have fared during the quarter ended June 2025.
- 07/11/2025
|
PNC Launches New Digital Direct Deposit: A Move to Boost Fee Income?
- Can PNC Financial's new mobile direct deposit feature boost fee income and strengthen customer relationships? Read on to explore more.
- 07/09/2025
|
The PNC Financial Services Group, Inc (PNC) Earnings Expected to Grow: Should You Buy?
- The PNC Financial Services Group (PNC) possesses the right combination of the two key ingredients for a likely earnings beat in its upcoming report. Get prepared with the key expectations.
- 07/09/2025
|
PNC Bank Introduces New Digital Direct Deposit Manager
- New PNC Mobile App functionality provides seamless client experience to manage direct deposit preferences PITTSBURGH , July 8, 2025 /PRNewswire/ -- PNC Bank today announced the launch of a new feature, PNC Direct Deposit, that provides clients with the ability to easily set up direct deposits for payroll, Social Security payments or other regular income, directly from the PNC Mobile app. "This integrated direct deposit solution is just another example of how PNC is continuously enhancing and improving the client experience," said Alex Overstrom, head of Retail Banking.
- 07/08/2025
|
PNC Financial Rewards Shareholders With a 6% Dividend Hike
- PNC hikes its quarterly dividend by 6% to $1.70 per share after clearing the Fed's 2025 stress test with strong capital ratios.
- 07/07/2025
|
Why The PNC Financial Services Group (PNC) is Poised to Beat Earnings Estimates Again
- The PNC Financial Services Group (PNC) has an impressive earnings surprise history and currently possesses the right combination of the two key ingredients for a likely beat in its next quarterly report.
- 07/03/2025
|
PNC Raises Common Stock Dividend To $1.70 Per Share
- PITTSBURGH , July 3, 2025 /PRNewswire/ -- The board of directors of The PNC Financial Services Group, Inc. (NYSE: PNC) declared a quarterly cash dividend on the common stock of $1.70 per share, an increase of $0.10 cents per share, or 6%, from the second quarter dividend of $1.60 per share. The dividend will be payable Aug. 5, 2025, to shareholders of record at the close of business July 15, 2025.
- 07/03/2025
|
Tariffs are unlikely to cause as much consumer disruption as feared, says PNC's Yung-Yu Ma
- Yung-Yu Ma, PNC Asset Management chief investment strategist, joins 'Money Movers' to discuss his market outlook, Trump's recent announcement of a trade deal with Vietnam and
- 07/02/2025
|
PNC Announces Stress Capital Buffer (SCB) and Planned Capital Actions
- PITTSBURGH , July 1, 2025 /PRNewswire/ -- The PNC Financial Services Group, Inc. (NYSE: PNC) last week received the results of the Federal Reserve's 2025 Comprehensive Capital Analysis and Review (CCAR). The Federal Reserve's CCAR disclosure included its estimate of PNC's minimum capital ratios for the period from the first quarter of 2025 through the first quarter of 2027 under the hypothetical Supervisory Severely Adverse scenario.
- 07/01/2025
|
Top 10 High-Yield Dividend Stocks For July 2025
- My July 2025 watchlist focuses on high-yield, attractively valued stocks, aiming for a 12% long-term CAGR and outperforming benchmarks. Since its inception, my watchlist has a CAGR of 15.11%, performing in-line with SPY and VYM, while providing a superior dividend yield. The June 2025 watchlist includes 10 stocks with an average forward dividend yield of 3.54% and an expected return of 13.62%.
- 07/01/2025
|
PNC Multifamily Capital Announces $208 Million Affordable Housing Fund, Increasing Access to Affordable Housing Across the U.S.
- PITTSBURGH , June 18, 2025 /PRNewswire/ -- PNC Bank, N.A., a tax credit syndication leader, today announced the closing of Low-Income Housing Tax Credit (LIHTC) Fund 98, which is investing more than $208 million in the development and rehabilitation of affordable rental housing across the U.S. The fund includes investments from PNC and seven other financial services and insurance companies, including two investors that are new to PNC's LIHTC funds.
- 06/18/2025
|
TFC vs. PNC: Which Regional Bank is Poised for More Growth?
- PNC leans into growth with new branches and acquisitions, while Truist makes efforts to enhance non-interest revenue sources.
- 06/17/2025
|
PNC Financial: Long-Term Investors Should Wait For A Pullback
- PNC Financial boasts strong geographic and business diversification versus peers, but near-term growth prospects remain muted. Sizable exposure to commercial real estate, especially office loans, poses ongoing risks despite recent improvements in asset quality. Profitability and capital ratios are acceptable but not industry-leading; dividend growth is expected to be modest going forward.
- 06/12/2025
|
The PNC Financial Services Group, Inc. (PNC) Presents at Morgan Stanley US Financials, Payments & CRE Conference (Transcript)
- The PNC Financial Services Group, Inc. (NYSE:PNC ) Morgan Stanley US Financials, Payments & CRE Conference June 11, 2025 1:45 PM ET Company Participants Robert Q. Reilly - EVP, CFO & Director William S.
- 06/11/2025
|
PNC Bank Launches PNC Mobile Accept®, A New Pay-As-You-Go Payment Processing Solution for Micro Businesses
- New solution enables small businesses to securely accept card payments via the PNC Mobile Banking App PITTSBURGH , June 11, 2025 /PRNewswire/ -- PNC Bank today announced the launch of PNC Mobile Accept® , a fully integrated payment solution that provides its micro business clients with the ability to accept in-person credit and debit card payments directly within the PNC Mobile app. Designed for businesses processing less than $300,000 in credit and debit card transactions annually, PNC Mobile Accept is a self-service solution that gives business owners fast, secure access to accept funds directly from their phone or tablet with no monthly fee.
- 06/11/2025
|
Profound Medical (NASDAQ:PROF) Shares Up 17.4% – What’s Next?
- Profound Medical Corp. (NASDAQ:PROF – Get Free Report) shares shot up 17.4% during mid-day trading on Tuesday . The stock traded as high as $6.90 and last traded at $6.75. 139,248 shares traded hands during trading, an increase of 117% from the average session volume of 64,191 shares. The stock had previously closed at $5.75. Analyst Upgrades and Downgrades Several brokerages have recently issued reports on PROF. Raymond James cut shares of Profound Medical from a “strong-buy” rating to a “moderate buy” rating in a research report on Friday, May 9th. Lake Street Capital reduced their price target on shares of Profound Medical from $17.00 to $11.00 and set a “buy” rating on the stock in a research report on Wednesday, April 23rd. Read Our Latest Stock Analysis on PROF Profound Medical Price Performance The firm has a market cap of $202.86 million, a price-to-earnings ratio of -5.04 and a beta of 0.48. The company has a quick ratio of 5.16, a current ratio of 6.12 and a debt-to-equity ratio of 0.11. The company’s 50-day moving average price is $4.95 and its 200-day moving average price is $6.33. Profound Medical (NASDAQ:PROF – Get Free Report) last issued its earnings results on Thursday, May 8th. The company reported ($0.36) earnings per share for the quarter, missing the consensus estimate of ($0.29) by ($0.07). The firm had revenue of $2.62 million during the quarter, compared to analyst estimates of $4.78 million. Profound Medical had a negative net margin of 349.41% and a negative return on equity of 85.22%. On average, equities research analysts forecast that Profound Medical Corp. will post -1.12 EPS for the current year. Insider Activity at Profound Medical In other news, CEO Arun Swarup Menawat bought 10,003 shares of Profound Medical stock in a transaction that occurred on Thursday, May 15th. The shares were purchased at an average price of $4.33 per share, with a total value of $43,312.99. Following the completion of the acquisition, the chief executive officer now directly owns 575,062 shares in the company, valued at $2,490,018.46. The trade was a 1.77% increase in their ownership of the stock. The acquisition was disclosed in a legal filing with the Securities & Exchange Commission, which can be accessed through this link. 1.52% of the stock is owned by corporate insiders. Hedge Funds Weigh In On Profound Medical Several hedge funds have recently added to or reduced their stakes in PROF. PNC Financial Services Group Inc. purchased a new position in Profound Medical in the first quarter valued at approximately $64,000. XTX Topco Ltd purchased a new position in Profound Medical in the fourth quarter valued at approximately $114,000. MTM Investment Management LLC increased its stake in Profound Medical by 10.4% in the fourth quarter. MTM Investment Management LLC now owns 18,575 shares of the company’s stock valued at $139,000 after purchasing an additional 1,750 shares during the last quarter. Marshall Wace LLP increased its stake in Profound Medical by 201.6% in the fourth quarter. Marshall Wace LLP now owns 36,216 shares of the company’s stock valued at $272,000 after purchasing an additional 24,208 shares during the last quarter. Finally, Northwest & Ethical Investments L.P. increased its stake in Profound Medical by 94.9% in the fourth quarter. Northwest & Ethical Investments L.P. now owns 46,200 shares of the company’s stock valued at $346,000 after purchasing an additional 22,500 shares during the last quarter. 47.86% of the stock is currently owned by hedge funds and other institutional investors. Profound Medical Company Profile (Get Free Report) Profound Medical Corp., together with its subsidiaries, operates as a commercial-stage medical device company that develops and markets incision-free therapeutic systems for the image guided ablation of diseased tissue in Canada, Germany, the United States, and Finland. Its lead product TULSA-PRO system combines magnetic resonance imaging(MRI), robotically-driven transurethral sweeping action/thermal ultrasound and closed-loop temperature feedback control to provide precise, flexible, and durable ablation of a surgeon defined region of prostate and protect the urethra and rectum. See Also Five stocks we like better than Profound Medical How to trade using analyst ratings AppLovin Dips on S&P 500 Snub, Morgan Stanley Lifts Target Anyway How to Use the MarketBeat Dividend Calculator Casey’s Surges on Strong Q4, More Gains Likely Ahead Retail Stocks Investing, Explained Government Mandate Sends eVTOL Stocks Flying
- 06/11/2025
|
3 Passive 'SWAN' Stocks (Hint: They're Not REITs)
- Buying and holding companies that provide reliable streams of passive income can help an investor stay one step ahead of bills. In today's article, I'll highlight a major midstream player, an electric and gas utility, and a super-regional bank/financial services company. Relative to my fair value estimates, the stocks vary from 9% to 16% discounted.
- 06/06/2025
|
PNC Announces Redemption of 5.812% Fixed Rate/Floating Rate Senior Notes Due June 12, 2026
- PITTSBURGH , June 4, 2025 /PRNewswire/ -- The PNC Financial Services Group, Inc. (NYSE: PNC) today announced the redemption of, on June 12, 2025, all outstanding 5.812% Fixed Rate/Floating Rate Senior Notes due June 12, 2026, issued by PNC in the amount of $1,000,000,000 (CUSIP 693475 BQ7). The securities have an original scheduled maturity date of June 12, 2026.
- 06/04/2025
|
PNC Financial Gains 17% in a Year: How to Approach the Stock Now?
- PNC stock moves up 17% in a year, but rising expenses and rate pressure are concerning. Read on to know if it is the right time to buy.
- 06/03/2025
|
The PNC Financial Services Group Announces Second Quarter Conference Call Details
- PITTSBURGH , June 3, 2025 /PRNewswire/ -- The PNC Financial Services Group, Inc. (NYSE: PNC) expects to issue financial results for the second quarter 2025 at approximately 6:30 a.m. (ET), Wednesday, July 16, 2025, as previously announced.
- 06/03/2025
|
Top 10 High-Yield Dividend Stocks
- The liberation day market selloff has been entirely recovered during the month of May. Since inception, my watchlist has a CAGR of 14.81%, performing in-line with SPY and VYM, while providing a superior dividend yield. The June 2025 watchlist includes 10 stocks with an average forward dividend yield of 3.62% and an expected return of 13.63%.
- 06/01/2025
|
PNC Executives to Speak at Morgan Stanley US Financials Investor Conference
- PITTSBURGH , May 28, 2025 /PRNewswire/ -- The PNC Financial Services Group, Inc. (NYSE: PNC) announced today that Chairman and Chief Executive Officer William S. Demchak and Executive Vice President and Chief Financial Officer Robert Q.
- 05/28/2025
|
PNC Financial: Still Cheap After The Recent Rally
- PNC is a buy due to its strong fundamentals, improving external environment, and attractive valuation relative to historical averages and return on equity. Recent earnings showed resilient net interest margins and stable asset quality, despite minor declines in deposits and loans from select segments. Management's guidance remains confident, expecting stable loan growth, modest deposit increases, and expanding net interest income as rate cuts lower funding costs.
- 05/22/2025
|
The PNC Financial Services Group Provides Quarterly 2026 Earnings Release Dates
- PITTSBURGH , May 22, 2025 /PRNewswire/ -- The PNC Financial Services Group, Inc. (NYSE: PNC) announced today it expects to issue 2026 quarterly earnings releases pre-market open and hold conference calls at 10 a.m. (ET) on the following dates: First Quarter – Wednesday, April 15, 2026 Second Quarter – Wednesday, July 15, 2026 Third Quarter –Thursday, October 15, 2026 Fourth Quarter – Friday, January 15, 2027 A link to the live audio webcast, presentation slides, earnings release and supplementary financial information will be made available at www.pnc.com/investorevents, and dial-in information will be provided at a later date.
- 05/22/2025
|
Wells Fargo Vs PNC Financial: Which Stock Has More Upside in 2025?
- WFC and PNC are making efforts to grow strategically. Read on to know which has more upside potential in 2025.
- 05/21/2025
|
PNC Financial's Arm Enters Deal to Acquire Aqueduct Capital Group
- PNC's subsidiary enters an agreement to acquire Aqueduct Capital Group, which will enhance the former's primary fund placement capabilities.
- 05/21/2025
|
PNC to Expand Primary Fund Placement Capabilities With Aqueduct Acquisition
- PNC Bank plans to acquire Aqueduct Capital Group to enhance the primary fund placement capabilities of PNC subsidiary Harris Williams. The bank has entered into a definitive agreement for the acquisition, and the transaction is expected to close in midsummer, subject to customary closing conditions, PNC Bank said in a Tuesday (May 20) press release.
- 05/20/2025
|
PNC Bank Agrees to Acquire Aqueduct Capital Group to Complement Harris Williams Capabilities
- Transaction furthers collective value proposition in primary fund placement PITTSBURGH , May 20, 2025 /PRNewswire/ -- PNC Bank today announced entry into a definitive agreement to acquire Aqueduct Capital Group, a placement agent focused on raising capital for private equity, private credit and real asset managers through its broad access to sophisticated, global pools of capital. Founded in 2003, Aqueduct has built a strong reputation advising its clients on a variety of fundraising solutions.
- 05/20/2025
|
PNC Bank Introduces PNC Spend Wise℠, A No Annual Fee Credit Card Offering A Purchase APR Reduction to Encourage Responsible Credit Habits
- New card incentivizes good financial practice via a suite of competitive features PITTSBURGH , May 12, 2025 /PRNewswire/ -- PNC Bank announced today the launch of its latest credit card, PNC Spend Wise℠ Visa® , designed to reward clients' responsible and healthy financial habits. This unique credit card is built to encourage responsible financial management through its associated purchase APR reduction program for eligible cardholders who meet timely payment and spend requirements.
- 05/12/2025
|
5 Relatively Secure And Cheap Dividend Stocks, Yields Up To 9% (May 2025)
- This article is part of our monthly series where we highlight five large-cap, relatively safe, dividend-paying companies offering significant discounts to their historical norms. We go over our filtering process to select just five conservative DGI stocks from more than 7,500 companies that are traded on U.S. exchanges, including OTC networks. In addition to the primary list that yields about 3.74%, we present two other groups of five DGI stocks each, from moderate to high yields of up to 9%.
- 05/03/2025
|
Top 10 High-Yield Dividend Stocks To Consider In May 2025
- Q2 2025 began with market volatility due to tariff announcements, resulting in SPY losing 0.87% and VYM declining by 3.54%. Since inception, my watchlist has a CAGR of 14.61%, outperforming SPY and VYM, and providing higher yields. The May 2025 watchlist includes 10 stocks with an average forward dividend yield of 3.59% and an expected return of 14.78%.
- 05/01/2025
|
Big Financial Companies That Pay Dependable High-Yield Dividends Can Survive Tariffs
- President Trump has set the stage for the beginning of the end of the world, taking advantage of unlimited largess from the United States, a practice that began after World War II and has been in place ever since.
- 04/30/2025
|
Bank of America Bullish on Blue-Chip Dividend Banks: 4 Strong Buy Stock Picks
- One very positive item for investors when earnings season rolls around every quarter is that the big money center and investment banks are always among the first to report.
- 04/28/2025
|
PNC Financial Q1: 2025 Guidance Reaffirmed; Stock Undervalued
- PNC Financial reported Q1 earnings with a slight revenue miss but a 12-cent EPS beat, showing 13.2% YoY growth despite a -6.9% QoQ decline. Management reaffirmed guidance for modest loan growth and net interest income increase but flagged potential tariff impacts on non-interest income. PNC's stock is undervalued, trading at 1.4x price-to-tangible book value, with a 4.20% dividend yield.
- 04/19/2025
|
PNC Leverages Technology to Help Clients Manage Uncertainty
- PNC Financial Services Group is leveraging technology and its other strengths as it helps clients manage the uncertainty caused by tariffs, executives said Tuesday (April 15) during the bank's quarterly earnings call.
- 04/15/2025
|
The PNC Financial Services Group, Inc. (PNC) Q1 2025 Earnings Call Transcript
- The PNC Financial Services Group, Inc. (NYSE:PNC ) Q1 2025 Earnings Conference Call April 15, 2025 10:00 AM ET Company Participants Bryan Gill - EVP and Director of IR Bill Demchak - Chairman and CEO Rob Reilly - EVP and CFO Conference Call Participants John Pancari - Evercore Bill Carcache - Wolfe Research Betsy Graseck - Morgan Stanley Scott Siefers - Piper Sandler Ebrahim Poonawala - Bank of America Mike Mayo - Wells Fargo Ken Usdin - Autonomous Research Erika Najarian - UBS Gerard Cassidy - RBC Capital Markets John McDonald - Truist Securities Matt O'Connor - Deutsche Bank Operator Greetings, and welcome to The PNC Financial Services Group First Quarter 2025 Earnings Conference Call. At this time all participants are in a listen-only mode.
- 04/15/2025
|
PNC Financial Q1 Earnings Top Estimates on Rise in NII & Fee Income
- PNC's first-quarter 2025 results reflect a rise in fee income and NII. Yet, increased expenses act as headwinds.
- 04/15/2025
|
The PNC Financial Services Group (PNC) Q1 Earnings: Taking a Look at Key Metrics Versus Estimates
- While the top- and bottom-line numbers for The PNC Financial Services Group (PNC) give a sense of how the business performed in the quarter ended March 2025, it could be worth looking at how some of its key metrics compare to Wall Street estimates and year-ago values.
- 04/15/2025
|
The PNC Financial Services Group, Inc (PNC) Surpasses Q1 Earnings and Revenue Estimates
- The PNC Financial Services Group, Inc (PNC) came out with quarterly earnings of $3.51 per share, beating the Zacks Consensus Estimate of $3.40 per share. This compares to earnings of $3.36 per share a year ago.
- 04/15/2025
|
PNC Financial first-quarter profit rises on higher interest income
- U.S. bank PNC Financial reported a rise in first-quarter profit on Tuesday, helped by a boost in interest income.
- 04/15/2025
|
PNC Reports First Quarter 2025 Net Income of $1.5 Billion, $3.51 Diluted EPS
- Expanded NIM; increased capital and TBV; maintained solid credit quality metrics PITTSBURGH , April 15, 2025 /PRNewswire/ -- The PNC Financial Services Group, Inc. (NYSE: PNC) today reported: For the quarter In millions, except per share data and as noted 1Q25 4Q24 1Q24 First Quarter Highlights Financial Results Comparisons reflect 1Q25 vs. 4Q24 Net interest income $ 3,476 $ 3,523 $ 3,264 Income Statement ▪ Net interest income decreased 1% driven by two fewer days in the quarter, partially offset by the benefit of lower funding costs and fixed rate asset repricing – NIM expanded 3 bps to 2.78% ▪ Fee income decreased 2% due to a slowdown in capital markets activity and seasonality ▪ Other noninterest income of $137 million included negative $40 million of Visa derivative adjustments ▪ Noninterest expense decreased 3% as a result of 4Q24 asset impairments and seasonality Balance Sheet ▪ Average loans decreased $2.4 billion, or 1% – Spot loans increased $2.4 billion, reflecting $4.7 billion, or 3%, growth in commercial and industrial loans ▪ Average deposits decreased $4.6 billion, or 1% ▪ Net loan charge-offs were $205 million, or 0.26% annualized to average loans ▪ AOCI improved $1.3 billion to negative $5.2 billion reflecting the movement of interest rates ▪ TBV per share increased 5% to $100.40 ▪ Maintained strong capital position – CET1 capital ratio of 10.6% – Repurchased approximately $200 million of common shares Fee income (non-GAAP) 1,839 1,869 1,746 Other noninterest income 137 175 135 Noninterest income 1,976 2,044 1,881 Revenue 5,452 5,567 5,145 Noninterest expense 3,387 3,506 3,334 Pretax, pre-provision earnings (non-GAAP) 2,065 2,061 1,811 Provision for credit losses 219 156 155 Net income 1,499 1,627 1,344 Per Common Share Diluted earnings per share (EPS) $ 3.51 $ 3.77 $ 3.10 Average diluted common shares outstanding 398 399 400 Book value 127.98 122.94 113.30 Tangible book value (TBV) (non-GAAP) 100.40 95.33 85.70 Balance Sheet & Credit Quality Average loans In billions $ 316.6 $ 319.1 $ 320.6 Average securities In billions 142.2 143.9 135.4 Average deposits In billions 420.6 425.3 420.2 Accumulated other comprehensive income (loss) (AOCI) In billions (5.2) (6.6) (8.0) Net loan charge-offs 205 250 243 Allowance for credit losses to total loans 1.64 % 1.64 % 1.68 % Selected Ratios Return on average common shareholders' equity 11.60 % 12.38 % 11.39 % Return on average assets 1.09 1.14 0.97 Net interest margin (NIM) (non-GAAP) 2.78 2.75 2.57 Noninterest income to total revenue 36 37 37 Efficiency 62 63 65 Effective tax rate 18.8 14.6 18.8 Common equity Tier 1 (CET1) capital ratio 10.6 10.5 10.1 See non-GAAP financial measures in the Consolidated Financial Highlights accompanying this release.
- 04/15/2025
|
Regional bank reporting will be better reflection of economic uncertainty: RBC's Gerard Cassidy
- Gerard Cassidy, RBC Capital Markets Managing Director, joins 'Closing Bell Overtime' to talk quarterly banking results.
- 04/11/2025
|
Lower NII and Fee Income to Hurt PNC Financial's Q1 Earnings
- A decline in NII and fee income and a rise in provisions are expected to have hurt PNC's Q1 earnings.
- 04/10/2025
|
What Analyst Projections for Key Metrics Reveal About The PNC Financial Services Group (PNC) Q1 Earnings
- Evaluate the expected performance of The PNC Financial Services Group (PNC) for the quarter ended March 2025, looking beyond the conventional Wall Street top-and-bottom-line estimates and examining some of its key metrics for better insight.
- 04/10/2025
|
PNC Financial names former BlackRock executive as president
- PNC Financial Services Group on Monday appointed former BlackRock executive Mark Wiedman as president, effective immediately.
- 04/07/2025
|
Mark Wiedman Joins PNC As President
- Finance Executive to Accelerate Growth and Extend Strong Leadership Team PITTSBURGH , April 7, 2025 /PRNewswire/ -- The PNC Financial Services Group, Inc. (NYSE: PNC) today announced that its Board of Directors has unanimously appointed Mark Wiedman as president of the corporation and its wholly owned banking subsidiary, PNC Bank, National Association, effective immediately. Wiedman will report to PNC Chairman and Chief Executive Officer William S.
- 04/07/2025
|
PNC Taps Ex-BlackRock Star Mark Wiedman as President
- Once an heir apparent for Larry Fink, Wiedman now tops the list of potential successors to PNC CEO Bill Demchak.
- 04/07/2025
|
Why The PNC Financial Services Group (PNC) Could Beat Earnings Estimates Again
- The PNC Financial Services Group (PNC) has an impressive earnings surprise history and currently possesses the right combination of the two key ingredients for a likely beat in its next quarterly report.
- 04/03/2025
|
PNC Declares Dividend of $1.60 on Common Stock
- PITTSBURGH , April 3, 2025 /PRNewswire/ -- The board of directors of The PNC Financial Services Group, Inc. (NYSE: PNC) declared a quarterly cash dividend on the common stock of $1.60 per share. The dividend will be payable May 5, 2025, to shareholders of record at the close of business April 16, 2025.
- 04/03/2025
|
My Top 10 High-Yield Dividend Stocks For April 2025
- Q1 2025 ended negatively for SPY and VYM, but my watchlist outperformed, limiting losses to 1.38% and achieving a YTD gain of 1.89%. Since inception, my watchlist has a CAGR of 15.83%, outperforming SPY and VYM, and providing higher yields. The April 2025 watchlist includes 10 stocks with an average forward dividend yield of 3.48% and an expected return of 15.43%.
- 04/01/2025
|
Why The PNC Financial Services Group, Inc (PNC) is a Great Dividend Stock Right Now
- Dividends are one of the best benefits to being a shareholder, but finding a great dividend stock is no easy task. Does The PNC Financial Services Group, Inc (PNC) have what it takes?
- 03/27/2025
|
PNC Financial: A Smart Deposit After 21% Drop
- PNC Financial Services is slightly less efficient than peers, but its stock has dropped 20%+ since November, presenting a potential value opportunity. Strengths include corporate banking operations and deposit stability, but PNC lacks clear growth catalysts beyond branch expansion. Valuation metrics suggest PNC is favorably priced, with a 27% margin of safety based on Wall Street's consensus price target.
- 03/15/2025
|
Why The PNC Financial Services Group, Inc (PNC) is a Top Dividend Stock for Your Portfolio
- Dividends are one of the best benefits to being a shareholder, but finding a great dividend stock is no easy task. Does The PNC Financial Services Group, Inc (PNC) have what it takes?
- 03/11/2025
|
Down -11.58% in 4 Weeks, Here's Why The PNC Financial Services Group (PNC) Looks Ripe for a Turnaround
- The heavy selling pressure might have exhausted for The PNC Financial Services Group (PNC) as it is technically in oversold territory now. In addition to this technical measure, strong agreement among Wall Street analysts in revising earnings estimates higher indicates that the stock is ripe for a trend reversal.
- 03/07/2025
|
Down -9.26% in 4 Weeks, Here's Why The PNC Financial Services Group (PNC) Looks Ripe for a Turnaround
- The PNC Financial Services Group (PNC) has become technically an oversold stock now, which implies exhaustion of the heavy selling pressure on it. This, combined with strong agreement among Wall Street analysts in revising earnings estimates higher, indicates a potential trend reversal for the stock in the near term.
- 03/06/2025
|
The PNC Financial Services Group Announces First Quarter 2025 Earnings Conference Call, Virtual-Only Annual Shareholders Meeting Details
- PITTSBURGH , March 4, 2025 /PRNewswire/ -- The PNC Financial Services Group, Inc. (NYSE: PNC) expects to issue financial results for the first quarter of 2025 at approximately 6:30 a.m. (ET), Tuesday, April 15, as previously announced.
- 03/04/2025
|
Business Owners Optimistic on National and Local Economy
- 78% of small and mid-sized business owners are optimistic about prospects for their own business, near the 23-year survey high mark of 79% recorded a year ago. Half of owners are optimistic about the national economy, just under the survey-high level of 56% recorded last fall.
- 03/03/2025
|
My Top 10 High-Yield Dividend Stocks For March 2025
- SPY stumbles in February, erasing some of its year-to-date gains. VYM is running strong and extends its lead over SPY in 2025. The top 10 stocks on the watchlist for March 2025 offer a 3.56% dividend yield, nearly triple that of the S&P 500. My top 10 list of high dividend yield stocks has generated an annualized rate of return of 16.53% since its inception in November 2020.
- 03/03/2025
|
PNC vs. TW: Which Stock Should Value Investors Buy Now?
- Investors looking for stocks in the Financial - Investment Bank sector might want to consider either The PNC Financial Services Group, Inc (PNC) or Tradeweb Markets (TW). But which of these two stocks presents investors with the better value opportunity right now?
- 02/24/2025
|
Here's Why You Should Add PNC Financial to Your Portfolio Now
- PNC's strong liquidity position, strategic initiatives and solid growth trajectory look encouraging.
- 02/20/2025
|
The PNC Financial Services Group, Inc (PNC) Could Be a Great Choice
- Dividends are one of the best benefits to being a shareholder, but finding a great dividend stock is no easy task. Does The PNC Financial Services Group, Inc (PNC) have what it takes?
- 02/20/2025
|
My Top 10 High Dividend Yield Stocks For February 2025: Two Yield Over 7%
- Implementing a high dividend yield strategy can provide substantial income and stability during market volatility, supporting long-term investment goals without selling during declines. The selected 10 companies offer Dividend Yields [FWD] between 3.22% and 8.06%, with attractive Dividend Growth Rates and appealing valuations, enhancing portfolio sustainability. Each company exhibits a P/E [FWD] Ratio below 20, which reflects their attractive valuation.
- 02/13/2025
|
Big bank CEOs to meet with lawmakers on solutions to debanking
- A group of CEOs from leading U.S. banks are meeting with the Senate Banking Committee to discuss potential solutions to regulatory issues related to debanking decisions.
- 02/13/2025
|
PNC or TW: Which Is the Better Value Stock Right Now?
- Investors interested in stocks from the Financial - Investment Bank sector have probably already heard of The PNC Financial Services Group, Inc (PNC) and Tradeweb Markets (TW). But which of these two stocks presents investors with the better value opportunity right now?
- 02/07/2025
|
PNC Appoints Douglas Dachille to Board of Directors
- PITTSBURGH , Feb. 3, 2025 /PRNewswire/ -- The PNC Financial Services Group, Inc. (NYSE: PNC) appointed Douglas Dachille to its board of directors effective today. He has also been appointed to the board's risk committee.
- 02/03/2025
|
Are You Looking for a High-Growth Dividend Stock?
- Dividends are one of the best benefits to being a shareholder, but finding a great dividend stock is no easy task. Does The PNC Financial Services Group, Inc (PNC) have what it takes?
- 02/03/2025
|
My Top 10 High-Yield Dividend Stocks For February 2025
- SPY kicks off 2025 with a gain of 2.67% in January. VYM is off to an even better start with a gain of 3.75%. The top 10 stocks on the watchlist for February 2025 offer a 3.43% dividend yield, nearly triple that of the S&P 500. My top 10 list of high dividend yield stocks has generated an annualized rate of return of 15.95% since its inception in November 2020.
- 02/03/2025
|
Steven Cress' Top 10 Dividend Stocks For 2025
- Steven Cress talks to Kim Khan about his top dividend stocks for the year. Diversification and strong fundamentals are key strategies for investors.
- 01/29/2025
|
PNC Executive to Speak at UBS Financial Services Conference
- PITTSBURGH , Jan. 28, 2025 /PRNewswire/ -- The PNC Financial Services Group, Inc. (NYSE: PNC) announced today that Executive Vice President and Chief Financial Officer Robert Q. Reilly will discuss business performance and strategy at 11:20 a.m.
- 01/28/2025
|
PNC Looks Good Now, And Loan Growth Reacceleration Would Make It Even Better
- Despite some weaknesses in loan growth and deposit performance, PNC's Q4 results were among the best of its peers, with impressive net interest income and margin improvements. PNC's growth outlook is robust, with management expecting stable loan balances and significant net interest income growth, driven by controlled deposit costs and strategic market expansion. PNC is a conservatively-run commercial-focused bank with solid earnings growth, low downside risk, and a strong management team, with less of its upside tied to rebounding from prior underperformance.
- 01/25/2025
|
President Michael P. Lyons to Depart PNC
- Will Assume President & CEO-Elect Role at Fiserv PITTSBURGH , Jan. 23, 2025 /PRNewswire/ -- The PNC Financial Services Group, Inc. (NYSE: PNC) announced today that President Michael P. Lyons is departing PNC to assume the President & CEO-Elect role at Fiserv.
- 01/23/2025
|
PNC vs. TW: Which Stock Is the Better Value Option?
- Investors interested in stocks from the Financial - Investment Bank sector have probably already heard of The PNC Financial Services Group, Inc (PNC) and Tradeweb Markets (TW). But which of these two stocks presents investors with the better value opportunity right now?
- 01/22/2025
|
PNC Financial: Likely Fairly Valued Now
- PNC Financial reported strong Q4 earnings, with a 4% Y/Y increase in net interest income and an 84% surge in profitability. The absence of FDIC assessment fees and lower credit provisions contributed significantly to PNC Financial's improved earnings and balance sheet quality. PNC Financial's FY 2025 guidance projects a 6-7% growth in net interest income, reflecting continued strength in its core lending business.
- 01/21/2025
|
PNC Financial Positioned For Strong Loan Expansion And Yield Curve Benefits, Analyst Predicts Net Interest Income Growth Through 2026
- PNC Financial Services Group PNC reported fourth-quarter results last week. Revenue increased 4% year-over-year to $5.57 billion, beating the consensus of $5.50 billion.
- 01/21/2025
|
The PNC Financial Services Group, Inc (PNC) is a Great Momentum Stock: Should You Buy?
- Does The PNC Financial Services Group, Inc (PNC) have what it takes to be a top stock pick for momentum investors? Let's find out.
- 01/21/2025
|
4 Stocks to Buy for "Higher for Longer" Interest Rates
- Markets tumbled this week as a number of factors came into focus, pointing toward rates that would remain higher for longer. A hot jobs report sent stocks plummeting as the economy added 256,000 jobs vs 155,000 expected, dampening the prospects of multiple rate cuts in 2025.
- 01/17/2025
|
Why The PNC Financial Services Group, Inc (PNC) is a Great Dividend Stock Right Now
- Dividends are one of the best benefits to being a shareholder, but finding a great dividend stock is no easy task. Does The PNC Financial Services Group, Inc (PNC) have what it takes?
- 01/17/2025
|
PNC to Complement Branch Expansion With New Online Banking Platform
- PNC Financial Service Group will soon roll out a new online banking platform that will complement its investment in new branch locations and renovations, bank executives said Thursday (Jan. 16).
- 01/16/2025
|
The PNC Financial Services Group, Inc. (PNC) Q4 2024 Earnings Call Transcript
- The PNC Financial Services Group, Inc. (NYSE:PNC ) Q4 2024 Earnings Conference Call January 16, 2025 10:00 AM ET Company Participants Bryan Gill - EVP and Director of IR Bill Demchak - Chairman and CEO Rob Reilly - EVP and CFO Conference Call Participants John McDonald - Truist Securities Scott Siefers - Piper Sandler Erika Najarian - UBS John Pancari - Evercore Mike Mayo - Wells Fargo Betsy Graseck - Morgan Stanley Gerard Cassidy - RBC Capital Markets Bill Carcache - Wolfe Research Matt O'Connor - Deutsche Bank Ebrahim Poonawala - Bank of America Operator Greetings, and welcome to the PNC Financial Services Group Fourth Quarter 2024 Earnings Conference Call. At this time, all participants are in a listen-only mode.
- 01/16/2025
|
PNC Financial Q4 Earnings Beat Estimates, NII & Fee Income Rise Y/Y
- Strong fee income, higher deposit balances, along with lower expenses, support PNC's Q4 earnings. Yet, a decline in loan balance remains a near-term concern.
- 01/16/2025
|
Compared to Estimates, The PNC Financial Services Group (PNC) Q4 Earnings: A Look at Key Metrics
- While the top- and bottom-line numbers for The PNC Financial Services Group (PNC) give a sense of how the business performed in the quarter ended December 2024, it could be worth looking at how some of its key metrics compare to Wall Street estimates and year-ago values.
- 01/16/2025
|
The PNC Financial Services Group, Inc (PNC) Q4 Earnings and Revenues Surpass Estimates
- The PNC Financial Services Group, Inc (PNC) came out with quarterly earnings of $3.77 per share, beating the Zacks Consensus Estimate of $3.30 per share. This compares to earnings of $3.16 per share a year ago.
- 01/16/2025
|
PNC Financial's profit rises on interest income growth, lower rainy-day funds
- PNC Financial on Thursday reported a higher fourth-quarter profit as it earned more in interest payments and set aside less capital to cover potential loan defaults.
- 01/16/2025
|
PNC Reports Full Year 2024 Net Income of $6.0 Billion, $13.74 Diluted EPS
- Generated Positive Operating Leverage Fourth Quarter 2024 net income was $1.6 billion, $3.77 diluted EPS Grew NII and NIM; increased deposits and capital PITTSBURGH , Jan. 16, 2025 /PRNewswire/ -- The PNC Financial Services Group, Inc. (NYSE: PNC) today reported: For the quarter For the year In millions, except per share data and as noted 4Q24 3Q24 2024 2023 Fourth Quarter Highlights Financial Results Comparisons reflect 4Q24 vs. 3Q24 Net interest income (NII) $ 3,523 $ 3,410 $ 13,499 $ 13,916 Income Statement ▪ Net interest income increased 3% and NIM expanded 11 bps ▪ Fee income decreased 4%, due to elevated 3Q24 residential mortgage and capital markets activity ▪ Other noninterest income of $175 million ▪ Noninterest expense increased 5% and included $97 million of asset impairments and the benefit of an $18 million FDIC special assessment reduction.
- 01/16/2025
|
PNC Financial Earnings Are Imminent; These Most Accurate Analysts Revise Forecasts Ahead Of Earnings Call
- The PNC Financial Services Group, Inc. PNC will release earnings results for its fourth quarter, before the opening bell on Thursday, Jan. 16, 2025.
- 01/15/2025
|
Jim Cramer Positive on Top Blue Chip Bank Dividend Stocks: Buy These 4 Right Now Before Earnings
- We have covered Jim Cramer for almost 20 years here at 24/7 Wall St.
- 01/13/2025
|
Wall Street's Insights Into Key Metrics Ahead of The PNC Financial Services Group (PNC) Q4 Earnings
- Beyond analysts' top -and-bottom-line estimates for The PNC Financial Services Group (PNC), evaluate projections for some of its key metrics to gain a better insight into how the business might have performed for the quarter ended December 2024.
- 01/13/2025
|
NII Growth to Aid PNC Financial's Q4 Earnings, High Costs to Hurt
- PNC's Q4 2024 results are likely to benefit from a rise in NII. However, rising costs and lower fee income are concerns.
- 01/10/2025
|
Options Corner: BAC, PNC, XLF
- Today's Options Corner looks at real-life trades in Bank of America (BAC), PNC Financial (PNC), and the SPDR S&P Financial Sector ETF (XLF) ahead of big banks reporting earnings next week. Rick Ducat walks through the options strategies and what the traders might be thinking.
- 01/09/2025
|
The PNC Financial Services Group, Inc (PNC) Earnings Expected to Grow: What to Know Ahead of Next Week's Release
- The PNC Financial Services Group (PNC) possesses the right combination of the two key ingredients for a likely earnings beat in its upcoming report. Get prepared with the key expectations.
- 01/09/2025
|
JP Morgan's Best 2025 Stock Ideas Include 5 Blue-Chip Dividend Giants
- With all of the major indices making solid moves higher in 2024, we were very interested to see what the top prognosticators across Wall Street think is in store for 2025 as we start the second quarter of the new century.
- 01/08/2025
|
PNC Financial: A Stable Dividend Grower Struggling With Loan Growth And Loan Losses
- PNC Financial gets its prior hold rating reaffirmed, as its stable dividend growth is overshadowed by weak loan growth and rising loan loss provisions. Macro factors like credit card demand could be a boost, but the risk of rising loan delinquencies and high-interest rates could have an impact. A strong profit margin vs similar banking peers is a plus.
- 01/07/2025
|
PNC Declares Dividend of $1.60 on Common Stock
- PITTSBURGH , Jan. 3, 2025 /PRNewswire/ -- The board of directors of The PNC Financial Services Group, Inc. (NYSE: PNC) declared a quarterly cash dividend on the common stock of $1.60 per share. The dividend will be payable Feb. 5, 2025, to shareholders of record at the close of business Jan. 15, 2025.
- 01/03/2025
|
Will The PNC Financial Services Group (PNC) Beat Estimates Again in Its Next Earnings Report?
- The PNC Financial Services Group (PNC) has an impressive earnings surprise history and currently possesses the right combination of the two key ingredients for a likely beat in its next quarterly report.
- 01/02/2025
|
My Top 10 High-Yield Dividend Stocks For January 2025
- SPY ends 2024 on a sour note but with a total gain of 24.89%. The top 10 stocks on the watchlist for January 2025 offer a 3.45% dividend yield, nearly triple that of the S&P 500. My top 10 list of high dividend yield stocks has generated an annualized rate of return of 16.33% since its inception in November 2020.
- 01/01/2025
|
PNC Financial Stock Gains 26.8% in 6 Months: Should You Buy for 2025?
- PNC rises 26.8% in six months. Let us find out the reasons behind the bullish investor sentiments and analyze if the stock is worth buying for 2025.
- 12/26/2024
|
PNC Bank, N.A. Changes Prime Rate
- PITTSBURGH , Dec. 18, 2024 /PRNewswire/ -- PNC Bank, N.A. announced a decrease in its prime lending rate.
- 12/18/2024
|
The PNC Financial Services Group, Inc. (PNC) Goldman Sachs 2024 U.S. Financial Services Conference Transcript
- The PNC Financial Services Group, Inc. (NYSE:PNC ) Goldman Sachs 2024 U.S. Financial Services Conference Transcript November 10, 2024 1:00 PM ET Company Participants William Demchak - CEO and Chairman Robert Reilly - Vice President & Chief Financial Officer Conference Call Participants Richard Ramsden - Goldman Sachs Richard Ramsden Okay, so I'm delighted to be joined by Bill Demchak. Bill is the CEO and Chairman of PNC.
- 12/10/2024
|
PNC says banks with core retail deposits could be M&A targets
- PNC Financial Services Group would look at banks with core retail deposits in the right markets for mergers and acquisitions, but would avoid lenders with heavy real estate exposure, its CEO said on Tuesday.
- 12/10/2024
|
November jobs report shows hiring and consumers are in 'good shape,' says PNC's Gus Faucher
- Gus Faucher, chief economist at PNC, joins CNBC's 'Power Lunch' to discuss the latest jobs report, economic outlooks, and more.
- 12/06/2024
|
The PNC Financial Services Group Announces Fourth Quarter and Full Year Conference Call Details
- PITTSBURGH , Dec. 5, 2024 /PRNewswire/ -- The PNC Financial Services Group, Inc. (NYSE: PNC) expects to issue financial results for the fourth quarter and full year 2024 at approximately 6:30 a.m. (ET), Thursday, Jan. 16, 2025, as previously announced.
- 12/05/2024
|
My Top 10 High-Yield Dividend Stocks For December 2024
- SPY continues its strong run in 2024 with a gain of +5.96% in November. The top 10 stocks on the watchlist for December 2024 offer a 3.34% dividend yield, more than double the S&P 500. My top 10 list of high dividend yield stocks has generated an annualized rate of return of 18.61% since its inception in November 2020.
- 12/01/2024
|
PNC Executives to Speak at Goldman Sachs Financial Services Conference
- PITTSBURGH , Nov. 26, 2024 /PRNewswire/ -- The PNC Financial Services Group, Inc. (NYSE: PNC) announced today that Chairman and Chief Executive Officer William S. Demchak and Executive Vice President and Chief Financial Officer Robert Q.
- 11/26/2024
|
Tax Fight With Clarendon Hills Appears Over
- HINSDALE, IL – Hinsdale High School District 86 officials sounded satisfied Thursday with a downsized tax district in Clarendon Hills. For months, the district had opposed a larger tax increment financing district, or TIF. "From where we started with this TIF proposal, this is pretty fantastic news for the district," said District 86 board President Catherine Greenspon. "I would agree it's a pretty significant change from what was originally proposed, so good progress," said Josh Stephenson, District 86's top finance official. On Monday, the Clarendon Hills Village Board unanimously approved the tax district along 55th Street to spur development. In doing so, the village made major concessions to District 86, Hinsdale District 181 and Maercker District 60, all of which criticized the larger district. Under state law, a tax district's growth in property tax income for 23 years would be diverted for use in the district itself, rather than taxing bodies such as schools. Last week, Clarendon Hills publicly unveiled its proposal to send the tax money from most of the properties in the TIF, including Jewel and PNC Bank, to other taxing bodies. But the village would keep the tax district's income from the vacant property that was once the site of Tracy's Tavern, which officials hope to see developed. With the changes, the village's expected TIF budget is down by half, to $12.6 million. "It's come down precipitously," District 86 board member Jeff Waters said. The District 86 board plans to vote next month on an agreement with the village on the tax district. Other local government bodies are expected to do the same.
- 11/25/2024
|
PNC Financial & GTreasury Team Up to Boost Digital Treasury Services
- PNC announces partnership with GTreasury to streamline treasury operations, increase efficiencies and reduce the complexities of managing multiple platforms.
- 11/22/2024
|
PNC Christmas Price Index Increases 5.4%, Significantly More Than The U.S. Consumer Price Index
- PNC calculates the cost of Christmas from the holiday song "The Twelve Days of Christmas" Recent inflation trends are repeating, much like the verses of the song itself Five of the 12 gifts had no increase compared to 2023 PITTSBURGH , Nov. 21, 2024 /PRNewswire/ -- National inflation levels may be on the decline, but when it comes to True Loves' gifts, the price of decking the halls keeps rising. Now in its 41st year, PNC Bank's annual Christmas Price Index® (PNC CPI) rose 5.4% — doubling last year's 2.7% increase and surpassing the Bureau of Labor Statistics' Consumer Price Index (BLS CPI) October year-over-year reading of 2.6%.
- 11/21/2024
|
GTreasury, PNC Bank Introduce Embedded Banking Integration Through PINACLE® Connect
- The new integration and user experience provides shared clients with workflow efficiencies, real-time balances, transactions, and payments automation The new integration and user experience provides shared clients with workflow efficiencies, real-time balances, transactions, and payments automation
- 11/21/2024
|
Why Is The PNC Financial Services Group (PNC) Up 10.2% Since Last Earnings Report?
- The PNC Financial Services Group (PNC) reported earnings 30 days ago. What's next for the stock?
- 11/14/2024
|
PNC Financial to Invest Additional $500M to Double Branch Openings
- PNC plans to invest an additional $500 million to double its branch openings and renovate 1,400 locations over the next five years.
- 11/11/2024
|
PNC Bank Increases Investment in New Branch Locations and Renovations
- PNC Bank increased the number of new branch locations and renovations it plans to complete over the next five years. The bank plans to open 200 new branch locations in 12 cities and renovate 1,400 existing branches during that time, investing $1.5 billion in these projects, it said in a Friday (Nov. 8) press release.
- 11/08/2024
|
The PNC Financial Services Group, Inc. (PNC) BancAnalysts Association of Boston Conference Transcript
- The PNC Financial Services Group, Inc. (NYSE:PNC ) BancAnalysts Association of Boston Conference November 8, 2024 8:15 AM ET Company Participants Dick Manuel - Columbia Threadneedle Investments, Equity Research Analyst Rob Reilly - Vice President & Chief Financial Officer Mike Lyons - President Conference Call Participants Mike Mayo - Wells Fargo Ryan Kenny - Morgan Stanley Joe Capone - Soros Fund Management Dick Manuel We're going to get going here. My name is Dick Manuel, Equity Research Analyst with Columbia Threadneedle Investments.
- 11/08/2024
|
PNC doubles down on branch expansion plan with additional $500 mln investment
- PNC Bank said on Friday it will increase its investment in branch expansion by an additional $500 million to open over 100 new locations and renovate 200 existing ones, doubling down on efforts to reach customers through physical locations.
- 11/08/2024
|
PNC Bank to Double Planned Branch Openings to More Than 200 Across Six States
- Company increases branch investment by $500 million with plans to build new locations in 12 cities PITTSBURGH , Nov. 8, 2024 /PRNewswire/ -- PNC Bank announced today it is increasing its branch investment by $500 million to open more than 100 additional new branches and renovate 200 more existing locations across the country. These plans expand upon the 100 new locations and 1,200 branch renovations the company announced in February.
- 11/08/2024
|
PNC Bank, N.A. Changes Prime Rate
- PITTSBURGH , Nov. 7, 2024 /PRNewswire/ -- PNC Bank, N.A. announced a decrease in its prime lending rate.
- 11/07/2024
|
The PNC Financial Services Group, Inc (PNC) Just Reclaimed the 20-Day Moving Average
- After reaching an important support level, The PNC Financial Services Group, Inc (PNC) could be a good stock pick from a technical perspective. PNC surpassed resistance at the 20-day moving average, suggesting a short-term bullish trend.
- 11/07/2024
|
What Makes The PNC Financial Services Group, Inc (PNC) a Strong Momentum Stock: Buy Now?
- Does The PNC Financial Services Group, Inc (PNC) have what it takes to be a top stock pick for momentum investors? Let's find out.
- 11/06/2024
|
Strategic Expansion Supports PNC Financial Amid Higher Expenses
- PNC benefits from balance sheet strength and strategic growth initiatives. Rising expenses remain a concern.
- 11/06/2024
|
My Top 10 High-Yield Dividend Stocks For November 2024
- SPY's 5 month positive streak comes to an end in October as it posts a loss of 0.89%. The top 10 stocks on the watchlist for November 2024 offer a 3.61% dividend yield, more than double the S&P 500. My top 10 list of high dividend yield stocks has generated an annualized rate of return of 17.27% since its inception in November 2020.
- 11/03/2024
|
Are Finance Stocks Lagging The PNC Financial Services Group (PNC) This Year?
- Here is how The PNC Financial Services Group, Inc (PNC) and The Bank of New York Mellon Corporation (BK) have performed compared to their sector so far this year.
- 10/31/2024
|
PNC Announces Redemption Of All Depositary Shares Representing Interests In Series R Preferred Stock
- PITTSBURGH , Oct. 30, 2024 /PRNewswire/ -- The PNC Financial Services Group, Inc. (NYSE: PNC) today announced the redemption on Dec. 2, 2024, of $500,000,000 of Depositary Shares (CUSIP: 693475AM7) (the "Depositary Shares") representing interests in PNC's Fixed-To-Floating Rate Non-Cumulative Perpetual Preferred Stock, Series R (the "Series R Preferred Stock"). Each Depositary Share represents a 1/100th interest in a share of the Series R Preferred Stock.
- 10/30/2024
|
Economic experts share 2025 outlook at 61st Annual ASU/PNC Bank Luncheon
- Top economists provide insights on U.S. recession risks, Arizona growth, and global uncertainties. TEMPE, Ariz.
- 10/29/2024
|
PNC Executives to Speak at BancAnalysts Association of Boston Conference
- PITTSBURGH , Oct. 25, 2024 /PRNewswire/ -- The PNC Financial Services Group, Inc. (NYSE: PNC) announced today that President Michael P. Lyons and Executive Vice President and Chief Financial Officer Robert Q.
- 10/25/2024
|
PNC vs. TW: Which Stock Should Value Investors Buy Now?
- Investors looking for stocks in the Financial - Investment Bank sector might want to consider either The PNC Financial Services Group, Inc (PNC) or Tradeweb Markets (TW). But which of these two stocks is more attractive to value investors?
- 10/23/2024
|
PNC Announces Redemption of Senior Floating Rate Bank Notes Due Dec. 2, 2024 and 5.671% Fixed Rate/Floating Rate Senior Notes Due Oct. 28, 2025
- PITTSBURGH , Oct. 22, 2024 /PRNewswire/ -- The PNC Financial Services Group, Inc. (NYSE: PNC) today announced the redemption of, on Nov. 4, 2024, all outstanding Senior Floating Rate Bank Notes due Dec. 2, 2024 issued by PNC Bank, National Association in the amount of $200,000,000 (CUSIP 69353RFV5). The securities have an original scheduled maturity date of Dec. 2, 2024.
- 10/22/2024
|
2 Finance Stocks to Buy After Q3 Earnings: PGR & PNC
- Insurance giant Progressive Corporation (PGR) and banking leader PNC Financial Services Group (PNC) are two top-rated finance stocks to consider after exceeding their Q3 expectations on Tuesday.
- 10/17/2024
|
Here's Why The PNC Financial Services Group, Inc (PNC) is a Great Momentum Stock to Buy
- Does The PNC Financial Services Group, Inc (PNC) have what it takes to be a top stock pick for momentum investors? Let's find out.
- 10/16/2024
|
PNC Expects Loan Growth After Fed's Rate Cut
- PNC Financial Services Group said Tuesday (Oct. 15) that it is prepared for lending to pick up after the Federal Reserve cut interest rates in September. During the third quarter, which ended Sept.
- 10/15/2024
|
PNC Financial Q3 Earnings Beat on Higher Fee Income, Costs Rise
- The PNC Financial Services Group, Inc.'s PNC third-quarter 2024 adjusted earnings per share of $3.49 surpassed the Zacks Consensus Estimate of $3.29. In the prior-year quarter, the company reported earnings per share of $3.60.
- 10/15/2024
|
The PNC Financial Services Group, Inc. (PNC) Q3 2024 Earnings Call Transcript
- The PNC Financial Services Group, Inc. (NYSE:PNC ) Q3 2024 Earnings Conference Call October 15, 2024 10:00 AM ET Company Participants Bryan Gill - Executive Vice President and Director of Investor Relations Bill Demchak - Chairman and Chief Executive Officer Rob Reilly - Executive Vice President and Chief Financial Officer Conference Call Participants Erika Najarian - UBS John Pancari - Evercore Piper Sandler - Scott Siefers Matt O'Connor - Deutsche Bank Bill Carcache - Wolfe Research Mike Mayo - Wells Fargo Ebrahim Poonawala - Bank of America Betsy Graseck - Morgan Stanley Gerard Cassidy - RBC Capital Markets Operator Greetings, welcome to The PNC Financial Services Group Q3 2024 Earnings Conference Call. At this time, all participants are in a listen-only mode.
- 10/15/2024
|
The PNC Financial Services Group (PNC) Q3 Earnings: Taking a Look at Key Metrics Versus Estimates
- While the top- and bottom-line numbers for The PNC Financial Services Group (PNC) give a sense of how the business performed in the quarter ended September 2024, it could be worth looking at how some of its key metrics compare to Wall Street estimates and year-ago values.
- 10/15/2024
|
PNC Financial quarterly profit drops on lower interest income, higher provisions
- PNC Financial reported a 4% drop in third-quarter net profit on Tuesday, as it earned less from customer interest payment and set aside a bigger buffer of capital to cover loans that may not be repaid in an uncertain economy.
- 10/15/2024
|
The PNC Financial Services Group, Inc (PNC) Q3 Earnings and Revenues Beat Estimates
- The PNC Financial Services Group, Inc (PNC) came out with quarterly earnings of $3.49 per share, beating the Zacks Consensus Estimate of $3.29 per share. This compares to earnings of $3.60 per share a year ago.
- 10/15/2024
|
PNC Reports Third Quarter 2024 Net Income of $1.5 Billion, $3.49 Diluted EPS
- Generated positive operating leverage; grew NII; substantially increased fee income and TBV PITTSBURGH , Oct. 15, 2024 /PRNewswire/ -- The PNC Financial Services Group, Inc. (NYSE: PNC) today reported: For the quarter In millions, except per share data and as noted 3Q24 2Q24 3Q23 Third Quarter Highlights Financial Results Comparisons reflect 3Q24 vs. 2Q24 Net interest income (NII) $ 3,410 $ 3,302 $ 3,418 Income Statement ▪ Generated 1% positive operatingleverage ▪ Revenue stable; noninterest expense decreased 1%; PPNR increased 2% • NII grew 3%; NIM increased 4 bps • Fee income increased 10%, and included strong capital markets and advisory revenue • Other noninterest income of $69 million included negative Visa derivative fair value adjustments of $128 million; 2Q24 included the benefit of $141 million of significant items Balance Sheet ▪ Average loans were stable ▪ Average deposits and securitiesincreased 1% ▪ Net loan charge-offs were $286 million, or 0.36% annualized to average loans ▪ ACL to total loans stable at 1.7% ▪ AOCI improved $2.4 billion or 32% ▪ TBV per share increased 9% ▪ Maintained strong capital position – CET1 capital ratio of 10.3% – Repurchased more than $0.1 billion of common shares Fee income (non-GAAP) 1,953 1,777 1,721 Other noninterest income 69 332 94 Noninterest income 2,022 2,109 1,815 Revenue 5,432 5,411 5,233 Noninterest expense 3,327 3,357 3,245 Pretax, pre-provision earnings (PPNR) (non-GAAP) 2,105 2,054 1,988 Provision for credit losses 243 235 129 Net income 1,505 1,477 1,570 Per Common Share Diluted earnings per share (EPS) $ 3.49 $ 3.39 $ 3.60 Average diluted common shares outstanding 400 400 400 Book value 124.56 116.70 105.98 Tangible book value (TBV) (non-GAAP) 96.98 89.12 78.16 Balance Sheet & Credit Quality Average loans In billions $ 319.6 $ 319.9 $ 319.5 Average securities In billions 142.3 141.3 139.7 Average deposits In billions 422.1 417.2 422.5 Accumulated other comprehensive income (loss) (AOCI) In billions (5.1) (7.4) (10.3) Net loan charge-offs 286 262 121 Allowance for credit losses (ACL) to total loans 1.65 % 1.67 % 1.70 % Selected Ratios Return on average common shareholders' equity 11.72 % 12.16 % 13.65 % Return on average assets 1.05 1.05 1.12 Net interest margin (NIM) (non-GAAP) 2.64 2.60 2.71 Noninterest income to total revenue 37 39 35 Efficiency 61 62 62 Common equity Tier 1 (CET1) capital ratio 10.3 10.2 9.8 See non-GAAP financial measures in the Consolidated Financial Highlights accompanying this release.
- 10/15/2024
|
3-Stock Lunch: Delta Air Lines, Advanced Micro & PNC Bank
- Will McGough, Prime Capital Financial director of investments, joins 'Power Lunch' to discuss stock plays for three stocks.
- 10/10/2024
|
Exploring Analyst Estimates for The PNC Financial Services Group (PNC) Q3 Earnings, Beyond Revenue and EPS
- Besides Wall Street's top -and-bottom-line estimates for The PNC Financial Services Group (PNC), review projections for some of its key metrics to gain a deeper understanding of how the company might have fared during the quarter ended September 2024.
- 10/10/2024
|
The PNC Power Play: Strong Dividends, Smart Moves, And Room To Run
- PNC Financial excels in non-interest income and strategic diversification, with 40% of revenue from corporate and institutional banking, and disciplined expense management. Despite potential net interest income declines, PNC's strong balance sheet and capital flexibility offer resilience in a complex macroeconomic environment. PNC offers a compelling mix of growth and income with a 3.5% yield and a 9.3% five-year CAGR, though it faces risks from rate cuts and commercial real estate.
- 10/10/2024
|
Regional US banks favored by analysts going into quarterly earnings
- US banks' third quarter earnings are expected to benefit from upcoming Federal Reserve rate cuts, Bank of America analysts believe. Reduced rates could be a positive development for banks, particularly in a scenario where customer activity rebounds contributing to an economic soft landing, the analysts wrote in a note to clients.
- 10/09/2024
|
Rise in Net Interest Income to Support PNC Financial's Q3 Earnings
- PNC's Q3 2024 results are likely to benefit from a rise in NII and capital markets & advisory revenues. Yet, rising costs and lower fee income are concerns.
- 10/08/2024
|
The PNC Financial Services Group, Inc (PNC) Expected to Beat Earnings Estimates: Should You Buy?
- The PNC Financial Services Group (PNC) possesses the right combination of the two key ingredients for a likely earnings beat in its upcoming report. Get prepared with the key expectations.
- 10/08/2024
|
Will The PNC Financial Services Group (PNC) Beat Estimates Again in Its Next Earnings Report?
- The PNC Financial Services Group (PNC) has an impressive earnings surprise history and currently possesses the right combination of the two key ingredients for a likely beat in its next quarterly report.
- 10/03/2024
|
PNC Declares Dividend of $1.60 on Common Stock
- PITTSBURGH , Oct. 3, 2024 /PRNewswire/ -- The board of directors of The PNC Financial Services Group, Inc. (NYSE: PNC) declared a quarterly cash dividend on the common stock of $1.60 per share. The dividend will be payable Nov. 5, 2024, to shareholders of record at the close of business Oct. 16, 2024.
- 10/03/2024
|
PNC Bank Launches Akoya Integration for PINACLE Connect® to Provide More Secure, Transparent Data Access for Corporate Clients
- PITTSBURGH , Oct. 3, 2024 /PRNewswire/ -- PNC Bank and Akoya today announced the expansion of their existing integration to support corporate data sharing through the Akoya data access network. This feature enhances the ability of corporate clients to securely share their financial data with third parties, including fintechs and data aggregators, that power platforms they use to run their businesses, enhancing security and reliability through API-based connections.
- 10/03/2024
|
My Top 10 High-Yield Dividend Stocks For October 2024
- SPY locks in another positive month this year after gaining 2.10% in September. The top 10 stocks on the watchlist for October 2024 offer a 3.89% dividend yield, more than double the S&P 500. My top 10 list of high dividend yield stocks has generated an annualized rate of return of 17.96% since its inception in November 2020.
- 10/02/2024
|
Dividend Stocks With Strong Q4 Seasonality
- Entering October is the strongest period of the year for three-month returns, and shorter-term returns are also some of the best. Here we take a look at 30 dividend stocks in the S&P 500 that have been the best Q4 performers over the last ten years. 2024 has been a strong year already for high-yielding stocks, and now they have Q4 seasonality as another tailwind.
- 10/02/2024
|
Value Investor Chris Davis Cut All of His Bank Stock Holdings Except These Two
- Famed value investor Chris Davis runs Davis Selected Advisors, a hedge fund with $19.9 billion in assets under management.
- 09/29/2024
|
PNC Financial Aided by Expansion Strategies Amid Higher Expenses
- PNC's strategic growth efforts, a solid balance sheet, along with Fed's recent rate cut, are set to support its financials. Yet, rising costs remain a concern.
- 09/26/2024
|
PNC Enters Into Agreement With Plaid to Boost Customer Data Security
- PNC Financial and Plaid enter into a bilateral data access agreement to boost safety while sharing clients' financial data with third-party applications.
- 09/23/2024
|
PNC Bank, N.A. Changes Prime Rate
- PITTSBURGH , Sept. 18, 2024 /PRNewswire/ -- PNC Bank, N.A.
- 09/18/2024
|
This Bank Could Be the Next to $1 Trillion in Assets. Should You Buy the Stock Today?
- Most bank CEOs and investors see scale as an eventual necessity in the modern landscape of banking. There are a few larger regional banks that could eventually reach $1 trillion in assets.
- 09/18/2024
|
PNC Raises Q3 NII Outlook on Outperformance in Capital Markets
- PNC Financial expects Q3 NII to be at the higher end of its 1-2% growth range projected earlier, driven by its subsidiary's solid capital markets performance.
- 09/11/2024
|
PNC Financial: Looking Ahead To A Better 2025
- Regional bank stocks, particularly PNC, have surged due to more favorable interest rates and a steepening yield curve, enhancing profitability despite economic concerns. PNC's recent earnings beat normalized EPS estimates with a positive outlook for Q3, driven by higher non-interest income and controlled expenses. Key risks include potential slower loan growth and yield spread retreat, but PNC's strong nationwide presence and earnings growth forecast support a buy rating.
- 09/09/2024
|
PNC Financial: Interest Rate Cuts Could Increase Lending
- PNC Financial is well-positioned to benefit from the anticipated interest rate cuts, potentially boosting lending and refinancing demand in 2025. PNC's new rewards credit card and planned future card launches could drive growth through increased interest and fee income. Valuation metrics indicate PNC is reasonably valued with a forward PE of 13.7 and a price/book ratio of 1.5, suggesting potential for double-digit stock growth driven by earnings growth.
- 09/09/2024
|
Business Owners Remain Optimistic About Economy, According to PNC Survey
- 56% of small and mid-sized business owners surveyed are optimistic about the national economy – up significantly from 34% a year ago. 76% are highly optimistic about the prospects of their own business.
- 09/04/2024
|
The PNC Financial Services Group Announces Third Quarter Conference Call Details
- PITTSBURGH , Sept. 3, 2024 /PRNewswire/ -- The PNC Financial Services Group, Inc. (NYSE: PNC) expects to issue financial results for the third quarter 2024 at approximately 6:30 a.m.
- 09/03/2024
|
My Top 10 High-Yield Dividend Stocks For September 2024
- The bull run continues for SPY in August, with the ETF adding 2.34% to its year-to-date return. The watchlist posts two very strong back-to-back months of 5%+ returns. The top 10 stocks on the watchlist for September 2024 offer a 3.59% dividend yield, more than double the S&P 500.
- 09/01/2024
|
PNC Financial Hits 52-Week High: Is the Stock Worth Investing?
- PNC hits a new 52-week high driven by the Fed's indication of a rate cut starting next month.
- 08/29/2024
|
PNC Bank Survey Reveals Varying Financial Wellness Needs Across America's Most Generationally Diverse Workforce
- Annual Financial Wellness in the Workplace Report Highlights Workplace Stressors, Benefits Needs and Financial Goals Across Generations PITTSBURGH , Aug. 28, 2024 /PRNewswire/ -- PNC Bank today released findings from its second annual Financial Wellness in the Workplace Report entitled, "The Evolving Needs of the Multigenerational American Workforce," which summarizes survey data and in-depth interviews from more than 1,000 U.S. workers and more than 500 U.S. employers to better understand the financial health and wellness of today's workforce. Perhaps unsurprising in the current turbulent macroeconomic environment, the survey findings show that employers are continuing to feel the squeeze financially with the increased costs of benefits, worker retention and recruiting.
- 08/28/2024
|
PNC Executives To Speak At Barclays Global Financial Services Conference
- PITTSBURGH , Aug. 26, 2024 /PRNewswire/ -- The PNC Financial Services Group, Inc. (NYSE: PNC) announced today that Chairman and Chief Executive Officer William S. Demchak and Executive Vice President and Chief Financial Officer Robert Q.
- 08/26/2024
|
PNC Financial Upgraded: Analyst Highlights Company's Ability To Capitalize Opportunities From Market Dislocations
- BofA Securities analyst Ebrahim H. Poonawala upgraded PNC Financial Services Group, Inc. PNC to Buy from Neutral, raising the price objective to $200 from $185.
- 08/15/2024
|
3 Bank Stocks to Buy on the Dip: August 2024
- It's been a challenging start to the third quarter of 2024 for many stocks throughout the financial sector, and banking is no different. However, plenty of indicators suggest that the brightest bank stocks on Wall Street are well-placed to mount a recovery for investors.
- 08/13/2024
|
PNC Financial (PNC) Up 19.3% in Six Months: Will It Continue?
- PNC Financial (PNC) is well poised to benefit from a solid balance sheet and strategic initiatives and acquisitions.
- 08/12/2024
|
TFC or PNC: Which Is the Better Value Stock Right Now?
- Investors with an interest in Banks - Major Regional stocks have likely encountered both Truist Financial Corporation (TFC) and The PNC Financial Services Group, Inc (PNC). But which of these two stocks is more attractive to value investors?
- 07/30/2024
|
The PNC Financial Services Group, Inc (PNC) Is Up 7.70% in One Week: What You Should Know
- Does The PNC Financial Services Group, Inc (PNC) have what it takes to be a top stock pick for momentum investors? Let's find out.
- 07/19/2024
|
PNC Financial Services Beats Q2 Expectations, Analysts Raises Earnings Estimates For 2024 And 2025
- Shares of PNC Financial Services Group Inc PNC were climbing in early trading on Wednesday, after the company reported strong second-quarter results.
- 07/17/2024
|
PNC: Commercial Real Estate Drives 8% Rise in Net Loan Charge-Offs
- PNC Financial Services Group saw expected increases in total nonperforming loans and net loan charge-offs in the second quarter. The increases were primarily due to high commercial nonperforming loans and higher commercial real estate (CRE) net loan charge-offs, the bank said in a Tuesday (July 16) earnings release.
- 07/16/2024
|
Here's What Key Metrics Tell Us About The PNC Financial Services Group (PNC) Q2 Earnings
- While the top- and bottom-line numbers for The PNC Financial Services Group (PNC) give a sense of how the business performed in the quarter ended June 2024, it could be worth looking at how some of its key metrics compare to Wall Street estimates and year-ago values.
- 07/16/2024
|
Goldman Sachs Maintains Neutral on PNC Despite Strong Results, Cites Modest FY24 Outlook
- Goldman Sachs analyst Richard Ramsden anticipates a neutral investor response to PNC Financial Services Group, Inc.‘s PNC stronger results and updated FY24 guidance.
- 07/16/2024
|
The PNC Financial Services Group, Inc. (PNC) Q2 2024 Earnings Call Transcript
- The PNC Financial Services Group, Inc. (NYSE:PNC ) Earnings Conference Call July 16, 2024 10:00 AM ET Company Participants Bryan Gill - Director of IR William Demchak - Chairman, President & CEO Robert Reilly - EVP & CFO Conference Call Participants Betsy Graseck - Morgan Stanley John Pancari - Evercore Erika Najarian - UBS Scott Siefers - Piper Sandler Ebrahim Poonawala - Bank of America Bill Carcache - Wolfe Research Ken Usdin - Jefferies Mike Mayo - Wells Fargo Matt O'Connor - Deutsche Bank Gerard Cassidy - RBC Operator Greetings, and welcome to The PNC Financial Services Group Second Quarter 2024 Earnings Conference Call. At this time, all participants are in a listen-only mode.
- 07/16/2024
|
PNC Stock Surges on Q2 Revenue, Earnings Beat
- PNC Financial (PNC) shares surged over 4% Tuesday after the bank reported second-quarter profit and revenue that beat analysts' estimates. The bank also gave a stronger outlook for net interest income (NII).
- 07/16/2024
|
PNC Financial (PNC) Q2 Earnings Beat on Higher Fee Income
- The rise in non-interest income and higher loan balance support PNC Financial's (PNC) Q2 earnings, while lower net interest income and a rise in provisions act as headwinds.
- 07/16/2024
|
The PNC Financial Services Group, Inc (PNC) Tops Q2 Earnings and Revenue Estimates
- The PNC Financial Services Group, Inc (PNC) came out with quarterly earnings of $3.30 per share, beating the Zacks Consensus Estimate of $3 per share. This compares to earnings of $3.36 per share a year ago.
- 07/16/2024
|
PNC Reports Second Quarter 2024 Net Income of $1.5 Billion, $3.39 Diluted EPS
- Generated positive operating leverage; grew NII and NIM; maintained 2.5% SCB requirement Increased quarterly common stock dividend 5 cents to $1.60 per share on July 2, 2024 PITTSBURGH , July 16, 2024 /PRNewswire/ -- The PNC Financial Services Group, Inc. (NYSE: PNC) today reported: For the quarter In millions, except per share data and as noted 2Q24 1Q24 2Q23 Second Quarter Highlights Financial Results Comparisons reflect 2Q24 vs. 1Q24 Net interest income (NII) $ 3,302 $ 3,264 $ 3,510 Income Statement Noninterest income 2,109 1,881 1,783 ▪ Generated positive operating leverage; PPNR increased 13% Revenue 5,411 5,145 5,293 Noninterest expense 3,357 3,334 3,372 ▪ Revenue increased 5% Pretax, pre-provision earnings (PPNR) (non-GAAP) 2,054 1,811 1,921 – NII and NIM increased Provision for credit losses 235 155 146 ▪ Noninterest expense increased 1% Net income 1,477 1,344 1,500 ▪ Gain on Visa share exchange of$754 million substantially offset by other significant items, resulting in a 9 cent benefit to EPS Per Common Share Diluted earnings per share (EPS) $ 3.39 $ 3.10 $ 3.36 Balance Sheet Average diluted common shares outstanding 400 400 401 ▪ Average loans and deposits were relatively stable Book value 116.70 113.30 105.67 Tangible book value (TBV) (non-GAAP) 89.12 85.70 77.80 ▪ Average securities increased 4% ▪ Net loan charge-offs were $262 million, or 0.33% annualized to average loans Balance Sheet & Credit Quality Average loans In billions $ 319.9 $ 320.6 $ 324.5 ▪ ACL to total loans stable at 1.7% Average securities In billions 141.3 135.4 141.0 ▪ AOCI improved $0.6 billion, including securities repositioning impact Average deposits In billions 417.2 420.2 425.7 Accumulated other comprehensive income (loss) (AOCI) In billions (7.4) (8.0) (9.5) ▪ TBV per share increased 4% Net loan charge-offs 262 243 194 ▪ Maintained strong capital position Allowance for credit losses (ACL) to total loans 1.67 % 1.68 % 1.68 % – CET1 capital ratio of 10.2% – Maintained regulatory minimum Stress Capital Buffer (SCB) of2.5% Selected Ratios Return on average common shareholders' equity 12.16 % 11.39 % 13.01 % – Increased quarterly common stockdividend 5 cents to $1.60 per share on July 2, 2024 Return on average assets 1.05 0.97 1.08 Net interest margin (NIM) (non-GAAP) 2.60 2.57 2.79 Noninterest income to total revenue 39 37 34 Efficiency 62 65 64 Common equity Tier 1 (CET1) capital ratio 10.2 10.1 9.5 See non-GAAP financial measures in the Consolidated Financial Highlights accompanying this release.
- 07/16/2024
|
BAC, MS, PNC: Big Bank Earnings
- With Bank of America (BAC), Morgan Stanley (MS), and PNC Financial (PNC) earnings on deck, Kenneth Leon and Stephen Biggar discuss the overall space & what these reports mean for the financials sector. ======== Schwab Network ======== Empowering every investor and trader, every market day.
- 07/15/2024
|
Wall Street Brunch: Trump 'Fine' After Shooting
- Trump confirms he is "fine" after assassination attempt during rally in Pennsylvania, suspect dead. Global leaders condemn violence, wish Trump speedy recovery.
- 07/14/2024
|
Curious about The PNC Financial Services Group (PNC) Q2 Performance? Explore Wall Street Estimates for Key Metrics
- Looking beyond Wall Street's top -and-bottom-line estimate forecasts for The PNC Financial Services Group (PNC), delve into some of its key metrics to gain a deeper insight into the company's potential performance for the quarter ended June 2024.
- 07/11/2024
|
PNC Financial (PNC) to Post Q2 Earnings: Here's What to Expect
- PNC Financial's (PNC) second-quarter 2024 results are likely to be driven by an improved lending scenario and an increase in fee income, offset by rising expenses and higher provisions.
- 07/10/2024
|
Deutsche Bank Has 4 Sizzling ‘Fresh Money' Dividend Stock Picks for Q3
- 24/7 Insights With the S&P 500 up 15% year-to-date, a correction could be coming in the third quarter.
- 07/10/2024
|
Analysts Estimate The PNC Financial Services Group, Inc (PNC) to Report a Decline in Earnings: What to Look Out for
- The PNC Financial Services Group (PNC) doesn't possess the right combination of the two key ingredients for a likely earnings beat in its upcoming report. Get prepared with the key expectations.
- 07/09/2024
|
UBS leans into Bank of America ahead of micro-focused bank earnings
- UBS analysts on Monday called Bank of America Corp. the “most interesting money center,” as major banks approach second-quarter earnings season later this week.
- 07/08/2024
|
UBS upgrades PNC Financial to buy
- Erika Najarian, UBS large cap bank and consumer finance analyst, joins 'Squawk on the Street' to discuss how to pick the winners among the financials, why Najarian favors PNC, and more.
- 07/08/2024
|
Jobs data increases the likelihood that the Fed will cut twice this year, PNC's Gus Faucher
- Gus Faucher, chief economist at PNC, joins 'Power Lunch' to offer his jobs report reaction and expected Fed outlook.
- 07/05/2024
|
PNC Financial (PNC) Announces a 3% Hike in Quarterly Dividend
- PNC Financial (PNC) announces a quarterly dividend hike of 3% following the Fed's stress test results. Its solid balance sheet and earnings strength are set to support the capital distribution moves.
- 07/03/2024
|
The PNC Financial Services Group Provides Quarterly 2025 Earnings Release Dates
- PITTSBURGH , July 3, 2024 /PRNewswire/ -- The PNC Financial Services Group, Inc. (NYSE: PNC) announced today that it expects to issue 2025 quarterly earnings releases pre-market open and hold conference calls at the following times: First Quarter – Tuesday, April 15, 2025 at 10 a.m. (ET) Second Quarter – Wednesday, July 16, 2025 at 10 a.m.
- 07/03/2024
|
PNC Raises Common Stock Dividend To $1.60 Per Share
- PITTSBURGH , July 2, 2024 /PRNewswire/ -- The board of directors of The PNC Financial Services Group, Inc. (NYSE: PNC) declared a quarterly cash dividend on the common stock of $1.60 per share, an increase of $0.05 cents per share, or 3%, from the second quarter dividend of $1.55 per share. The dividend will be payable Aug. 5, 2024, to shareholders of record at the close of business July 15, 2024.
- 07/02/2024
|
Going Beyond Morningstar's 10 Best Value Stocks List
- Morningstar published 10 Best Value Stocks to Buy for the Long Term, undervalued blue-chip stocks with low price to fair value. Valuation and future return of each stock analyzed, compared to the S&P 500, Bristol-Myers has the highest potential rate of return. In comparison to Morningstar's 10 Best Value Stocks with 10 Best Dividend Stocks, Bristol-Myers stands out as undervalued with a high potential return.
- 07/01/2024
|
This is how much the largest 20 U.S. banks raised dividends after stress tests
- With another round of Federal Reserve stress tests in the books, many large U.S. banks have already announced dividend increases. Analysts at Jefferies compiled the data in a report sent to clients early Monday.
- 07/01/2024
|
PNC Releases Results of Dodd-Frank Company-Run Stress Test
- PITTSBURGH , June 28, 2024 /PRNewswire/ -- The PNC Financial Services Group, Inc. (NYSE: PNC) announced today the results of its biennial company-run stress test conducted in accordance with regulations of the Board of Governors of the Federal Reserve System (Federal Reserve) and the Office of the Comptroller of the Currency (OCC) under the Dodd-Frank Wall Street Reform and Consumer Protection Act. These company-run stress tests are designed to help assess whether banking organizations have sufficient capital to absorb losses and support operations during hypothetical severely adverse economic conditions over a nine-quarter projection period.
- 06/28/2024
|
PNC Announces Stress Capital Buffer (SCB) and Planned Capital Actions
- PITTSBURGH , June 28, 2024 /PRNewswire/ -- The PNC Financial Services Group, Inc. (NYSE: PNC) this week received the results of the Federal Reserve's 2024 Comprehensive Capital Analysis and Review (CCAR). The Federal Reserve's CCAR disclosure included its estimate of PNC's minimum capital ratios for the period from the first quarter of 2024 through the first quarter of 2026 under the hypothetical Supervisory Severely Adverse scenario.
- 06/28/2024
|
These numbers show that banks' risk from office real estate has been exaggerated
- By now you have probably seen myriad headlines about an alarming level of risk that banks are facing from potential losses on their portfolios of loans secured by office buildings. But there are fallacies in many media reports.
- 06/13/2024
|
The bank stocks that conservative investors should consider
- That's for at least two reasons. The first is higher interest rates: Many commercial mortgages are five-year balloons, which means that many loans extended at low rates in 2019 are repricing this year at much higher rates.
- 06/10/2024
|
Operation HOPE Welcomes PNC to Founder's Circle Membership
- ATLANTA--(BUSINESS WIRE)--Operation HOPE, a national nonprofit dedicated to helping low- and moderate-income Americans thrive in an ever-changing economy, is pleased to announce that The PNC Financial Services Group, Inc. (PNC) has joined as an elite Founder's Circle Member. Its $1 million commitment supports the growth and scale of Operation HOPE's mission to drive financial inclusion and economic equity across America. PNC and Operation HOPE have been working together for two decades to level.
- 06/10/2024
|
PNC Bank Launches $120,000 Scholarship Program to Expand Access to Higher Education
- Current and future college students can apply now for one of 12 available scholarships PITTSBURGH , June 5, 2024 /PRNewswire/ -- PNC Bank today introduced an enhanced program that will award $10,000 scholarships to 12 deserving students attending or planning to attend college across the country. PNC's existing, decade-long scholarship program currently awards $2,000 scholarships to 12 students each year.
- 06/05/2024
|
The PNC Financial Services Group Announces Second Quarter Conference Call Details
- PITTSBURGH , June 4, 2024 /PRNewswire/ -- The PNC Financial Services Group, Inc. (NYSE: PNC) expects to issue financial results for the second quarter 2024 at approximately 6:30 a.m. (ET), Tuesday, July 16, 2024, as previously announced.
- 06/04/2024
|
PNC Executive To Speak At Morgan Stanley Investor Conference
- PITTSBURGH , June 3, 2024 /PRNewswire/ -- The PNC Financial Services Group, Inc. (NYSE: PNC) announced today that Executive Vice President and Chief Financial Officer Robert Q. Reilly will discuss business performance and strategy at 1 p.m.
- 06/03/2024
|
Going Beyond Morningstar's 10 Best Dividend Stocks List
- Morningstar published their 10 Best Dividend Stocks, which are undervalued blue-chip stocks with reliable dividends. The article analyzes the valuation and estimated future total return of each stock, comparing them to the S&P 500. Comcast has the highest potential rate of return among the 10 stocks, while Sempra has the lowest.
- 05/27/2024
|
PNC CEO Bill Demchak on the state of the consumer
- Hosted by Brian Sullivan, “Last Call” is a fast-paced, entertaining business show that explores the intersection of money, culture and policy.
- 05/24/2024
|
Private Advisor Group LLC Has $524,000 Stock Holdings in BlackRock Health Sciences Term Trust (NYSE:BMEZ)
- Private Advisor Group LLC raised its stake in BlackRock Health Sciences Term Trust (NYSE:BMEZ – Free Report) by 24.0% during the 4th quarter, according to the company in its most recent disclosure with the Securities and Exchange Commission (SEC). The fund owned 35,791 shares of the company’s stock after purchasing an additional 6,935 shares during the period. Private Advisor Group LLC’s holdings in BlackRock Health Sciences Term Trust were worth $524,000 at the end of the most recent quarter. Other large investors also recently modified their holdings of the company. B. Riley Wealth Advisors Inc. raised its holdings in BlackRock Health Sciences Term Trust by 4.8% in the 3rd quarter. B. Riley Wealth Advisors Inc. now owns 17,363 shares of the company’s stock valued at $250,000 after acquiring an additional 796 shares during the period. Benjamin F. Edwards & Company Inc. lifted its holdings in shares of BlackRock Health Sciences Term Trust by 24.1% during the fourth quarter. Benjamin F. Edwards & Company Inc. now owns 4,792 shares of the company’s stock worth $70,000 after buying an additional 930 shares in the last quarter. Janney Montgomery Scott LLC grew its stake in shares of BlackRock Health Sciences Term Trust by 4.0% in the third quarter. Janney Montgomery Scott LLC now owns 30,936 shares of the company’s stock valued at $446,000 after acquiring an additional 1,199 shares in the last quarter. LPL Financial LLC raised its stake in BlackRock Health Sciences Term Trust by 0.5% in the 3rd quarter. LPL Financial LLC now owns 274,665 shares of the company’s stock worth $3,958,000 after purchasing an additional 1,231 shares in the last quarter. Finally, PNC Financial Services Group Inc. boosted its holdings in BlackRock Health Sciences Term Trust by 22.4% in the 3rd quarter. PNC Financial Services Group Inc. now owns 25,955 shares of the company’s stock valued at $374,000 after purchasing an additional 4,745 shares during the period. Insider Activity In other news, major shareholder Saba Capital Management, L.P. acquired 193,297 shares of the firm’s stock in a transaction that occurred on Tuesday, February 20th. The shares were acquired at an average cost of 15.92 per share, with a total value of 3,077,288.24. Following the completion of the purchase, the insider now directly owns 19,578,308 shares of the company’s stock, valued at approximately 311,686,663.36. The transaction was disclosed in a filing with the Securities & Exchange Commission, which can be accessed through the SEC website. In the last ninety days, insiders bought 701,207 shares of company stock worth $11,338,909. BlackRock Health Sciences Term Trust Trading Down 0.1 % NYSE BMEZ opened at 15.10 on Monday. The company has a 50 day moving average of 15.46 and a 200-day moving average of 15.10. BlackRock Health Sciences Term Trust has a 1-year low of 12.93 and a 1-year high of 16.59. BlackRock Health Sciences Term Trust Announces Dividend The company also recently announced a monthly dividend, which will be paid on Friday, May 31st. Shareholders of record on Wednesday, May 15th will be issued a $0.09 dividend. This represents a $1.08 annualized dividend and a yield of 7.15%. The ex-dividend date is Tuesday, May 14th. BlackRock Health Sciences Term Trust Company Profile (Free Report) BlackRock Health Sciences Trust II’s (BMEZ) (the ‘Trust’) investment objective is to provide total return and income through a combination of current income, current gains and long-term capital appreciation. The Trust seeks to achieve its investment objective by investing, under normal market conditions, at least 80% of its total assets in equity securities of companies principally engaged in the health sciences group of industries and equity derivatives with exposure to the health sciences group of industries.
- 05/20/2024
|
National Bank of Canada FI Has $53,000 Stake in Smith & Nephew plc (NYSE:SNN)
- National Bank of Canada FI lifted its position in shares of Smith & Nephew plc (NYSE:SNN – Free Report) by 36.0% in the 4th quarter, according to its most recent Form 13F filing with the Securities and Exchange Commission (SEC). The firm owned 1,967 shares of the medical equipment provider’s stock after buying an additional 521 shares during the period. National Bank of Canada FI’s holdings in Smith & Nephew were worth $53,000 at the end of the most recent quarter. Other institutional investors and hedge funds also recently modified their holdings of the company. Scharf Investments LLC boosted its position in shares of Smith & Nephew by 20.5% during the fourth quarter. Scharf Investments LLC now owns 2,980,334 shares of the medical equipment provider’s stock worth $81,304,000 after buying an additional 506,474 shares during the period. PNC Financial Services Group Inc. grew its stake in Smith & Nephew by 17.4% in the third quarter. PNC Financial Services Group Inc. now owns 36,315 shares of the medical equipment provider’s stock valued at $900,000 after purchasing an additional 5,384 shares in the last quarter. Seed Wealth Management Inc. acquired a new position in shares of Smith & Nephew during the 4th quarter worth approximately $213,000. London & Capital Asset Management Ltd bought a new stake in shares of Smith & Nephew during the 4th quarter worth approximately $1,054,000. Finally, Kornitzer Capital Management Inc. KS raised its stake in shares of Smith & Nephew by 38.8% during the 4th quarter. Kornitzer Capital Management Inc. KS now owns 245,609 shares of the medical equipment provider’s stock worth $6,700,000 after purchasing an additional 68,609 shares in the last quarter. 25.64% of the stock is owned by institutional investors and hedge funds. Smith & Nephew Stock Up 0.9 % Shares of NYSE:SNN opened at $26.09 on Monday. Smith & Nephew plc has a 52-week low of $21.52 and a 52-week high of $32.36. The company has a current ratio of 1.77, a quick ratio of 0.72 and a debt-to-equity ratio of 0.44. The company has a 50-day simple moving average of $25.21 and a 200 day simple moving average of $26.29. Smith & Nephew Dividend Announcement The firm also recently disclosed a semi-annual dividend, which will be paid on Wednesday, May 22nd. Stockholders of record on Tuesday, April 2nd will be given a $0.462 dividend. The ex-dividend date of this dividend is Monday, April 1st. This represents a dividend yield of 2.8%. Wall Street Analyst Weigh In Separately, StockNews.com downgraded shares of Smith & Nephew from a “strong-buy” rating to a “buy” rating in a report on Monday, May 13th. Three investment analysts have rated the stock with a hold rating and three have issued a buy rating to the stock. According to data from MarketBeat.com, the company has a consensus rating of “Moderate Buy”. View Our Latest Stock Analysis on Smith & Nephew About Smith & Nephew (Free Report) Smith & Nephew plc, together with its subsidiaries, develops, manufactures, markets, and sells medical devices and services in the United Kingdom and internationally. It operates through three segments: Orthopaedics, Sports Medicine & ENT, and Advanced Wound Management. The company offers knee implant products for knee replacement procedures; hip implants for revision procedures; trauma and extremities products that include internal and external devices used in the stabilization of severe fractures and deformity correction procedures; and other reconstruction products. Read More Five stocks we like better than Smith & Nephew Canada Bond Market Holiday: How to Invest and Trade MarketBeat Week in Review – 5/13 – 5/17 What is a Special Dividend? Take-Two Interactive Software Offers 2nd Chance for Investors Are These Liquid Natural Gas Stocks Ready For An Upside Bounce? Deere & Company’s Q2 Report: Strong Revenue, Cautious Outlook
- 05/20/2024
|
Amalgamated Bank Sells 686 Shares of New Fortress Energy Inc. (NASDAQ:NFE)
- Amalgamated Bank lowered its stake in shares of New Fortress Energy Inc. (NASDAQ:NFE – Free Report) by 5.0% during the 4th quarter, according to the company in its most recent filing with the SEC. The fund owned 13,130 shares of the company’s stock after selling 686 shares during the quarter. Amalgamated Bank’s holdings in New Fortress Energy were worth $495,000 at the end of the most recent quarter. Several other hedge funds and other institutional investors also recently bought and sold shares of the stock. Van ECK Associates Corp boosted its position in shares of New Fortress Energy by 15.3% during the third quarter. Van ECK Associates Corp now owns 3,623 shares of the company’s stock valued at $119,000 after buying an additional 482 shares during the period. ORG Partners LLC grew its position in New Fortress Energy by 14.3% in the 3rd quarter. ORG Partners LLC now owns 4,206 shares of the company’s stock valued at $138,000 after acquiring an additional 526 shares during the last quarter. Raymond James Financial Services Advisors Inc. purchased a new stake in New Fortress Energy in the fourth quarter worth $210,000. PNC Financial Services Group Inc. lifted its position in shares of New Fortress Energy by 5.0% during the third quarter. PNC Financial Services Group Inc. now owns 6,730 shares of the company’s stock worth $221,000 after purchasing an additional 319 shares during the last quarter. Finally, ELCO Management Co. LLC purchased a new position in New Fortress Energy in the 3rd quarter worth about $229,000. Hedge funds and other institutional investors own 58.61% of the company’s stock. Analysts Set New Price Targets Several research firms have issued reports on NFE. Deutsche Bank Aktiengesellschaft lowered their price objective on shares of New Fortress Energy from $35.00 to $33.00 and set a “hold” rating for the company in a research report on Thursday, May 9th. Barclays dropped their price objective on New Fortress Energy from $32.00 to $27.00 and set an “equal weight” rating on the stock in a research note on Monday, May 6th. Finally, Stifel Nicolaus reduced their price objective on New Fortress Energy from $45.00 to $43.00 and set a “buy” rating on the stock in a report on Thursday, May 9th. Four investment analysts have rated the stock with a hold rating and three have issued a buy rating to the company. According to data from MarketBeat.com, the company presently has an average rating of “Hold” and a consensus price target of $38.00. Read Our Latest Stock Analysis on New Fortress Energy New Fortress Energy Stock Up 2.5 % New Fortress Energy stock opened at $26.72 on Monday. New Fortress Energy Inc. has a twelve month low of $25.06 and a twelve month high of $40.04. The business has a fifty day moving average of $28.71 and a two-hundred day moving average of $32.62. The firm has a market cap of $5.48 billion, a P/E ratio of 12.15 and a beta of 1.55. The company has a quick ratio of 0.54, a current ratio of 0.66 and a debt-to-equity ratio of 3.74. New Fortress Energy (NASDAQ:NFE – Get Free Report) last posted its earnings results on Wednesday, May 8th. The company reported $0.67 earnings per share (EPS) for the quarter, beating the consensus estimate of $0.60 by $0.07. New Fortress Energy had a return on equity of 31.34% and a net margin of 17.90%. The company had revenue of $690.30 million for the quarter, compared to analyst estimates of $602.41 million. During the same quarter in the previous year, the firm earned $0.90 earnings per share. The firm’s quarterly revenue was up 19.2% compared to the same quarter last year. On average, analysts forecast that New Fortress Energy Inc. will post 2.07 earnings per share for the current fiscal year. New Fortress Energy Announces Dividend The company also recently declared a quarterly dividend, which will be paid on Thursday, June 27th. Shareholders of record on Saturday, June 15th will be issued a $0.10 dividend. This represents a $0.40 annualized dividend and a yield of 1.50%. The ex-dividend date of this dividend is Friday, June 14th. New Fortress Energy’s dividend payout ratio is currently 18.18%. New Fortress Energy Company Profile (Free Report) New Fortress Energy Inc operates as an integrated gas-to-power energy infrastructure company that provides energy and development services to end-users worldwide. The company operates in two segments, Terminals and Infrastructure, and Ships. The Terminals and Infrastructure segment engages in the natural gas procurement and liquefaction; and shipping, logistics, facilities and conversion, or development of natural gas-fired power generation. See Also Five stocks we like better than New Fortress Energy Retail Stocks Investing, Explained MarketBeat Week in Review – 5/13 – 5/17 Stock Ratings and Recommendations: Understanding Analyst Ratings Take-Two Interactive Software Offers 2nd Chance for Investors 3 Warren Buffett Stocks to Buy Now Deere & Company’s Q2 Report: Strong Revenue, Cautious Outlook Want to see what other hedge funds are holding NFE? Visit HoldingsChannel.com to get the latest 13F filings and insider trades for New Fortress Energy Inc. (NASDAQ:NFE – Free Report).
- 05/20/2024
|
Natixis Advisors L.P. Invests $218,000 in Arbor Realty Trust, Inc. (NYSE:ABR)
- Natixis Advisors L.P. purchased a new position in Arbor Realty Trust, Inc. (NYSE:ABR – Free Report) during the 4th quarter, according to its most recent Form 13F filing with the Securities and Exchange Commission (SEC). The firm purchased 14,368 shares of the real estate investment trust’s stock, valued at approximately $218,000. A number of other institutional investors and hedge funds have also recently bought and sold shares of the business. Sound Income Strategies LLC lifted its stake in Arbor Realty Trust by 322.1% in the 4th quarter. Sound Income Strategies LLC now owns 2,347 shares of the real estate investment trust’s stock worth $36,000 after purchasing an additional 1,791 shares in the last quarter. Anchor Investment Management LLC purchased a new position in Arbor Realty Trust during the fourth quarter worth approximately $41,000. Halpern Financial Inc. boosted its stake in Arbor Realty Trust by 601.8% during the fourth quarter. Halpern Financial Inc. now owns 3,509 shares of the real estate investment trust’s stock worth $52,000 after buying an additional 3,009 shares during the last quarter. PNC Financial Services Group Inc. grew its holdings in Arbor Realty Trust by 27.8% in the 3rd quarter. PNC Financial Services Group Inc. now owns 6,121 shares of the real estate investment trust’s stock valued at $93,000 after buying an additional 1,333 shares in the last quarter. Finally, Clearstead Advisors LLC acquired a new stake in shares of Arbor Realty Trust in the 3rd quarter worth $93,000. 57.25% of the stock is currently owned by institutional investors and hedge funds. Insider Buying and Selling In related news, Director William C. Green purchased 10,209 shares of Arbor Realty Trust stock in a transaction that occurred on Monday, March 18th. The stock was purchased at an average cost of $12.93 per share, with a total value of $132,002.37. Following the completion of the transaction, the director now directly owns 162,809 shares in the company, valued at $2,105,120.37. The acquisition was disclosed in a filing with the Securities & Exchange Commission, which is available through this link. 3.70% of the stock is owned by company insiders. Arbor Realty Trust Price Performance Shares of ABR opened at $13.89 on Monday. The firm has a market capitalization of $2.62 billion, a price-to-earnings ratio of 8.63 and a beta of 1.96. The firm’s fifty day simple moving average is $13.01 and its 200-day simple moving average is $13.45. Arbor Realty Trust, Inc. has a twelve month low of $11.77 and a twelve month high of $17.74. The company has a current ratio of 36.63, a quick ratio of 36.63 and a debt-to-equity ratio of 3.14. Arbor Realty Trust Announces Dividend The firm also recently announced a quarterly dividend, which will be paid on Friday, May 31st. Stockholders of record on Friday, May 17th will be given a dividend of $0.43 per share. This represents a $1.72 annualized dividend and a dividend yield of 12.38%. The ex-dividend date of this dividend is Thursday, May 16th. Arbor Realty Trust’s dividend payout ratio (DPR) is presently 106.83%. Analyst Upgrades and Downgrades ABR has been the topic of a number of analyst reports. TheStreet raised shares of Arbor Realty Trust from a “d+” rating to a “c” rating in a research note on Monday, March 18th. Keefe, Bruyette & Woods cut their target price on Arbor Realty Trust from $13.50 to $13.25 and set a “market perform” rating for the company in a research note on Wednesday, April 10th. JPMorgan Chase & Co. reduced their price objective on shares of Arbor Realty Trust from $12.50 to $12.00 and set an “underweight” rating on the stock in a report on Wednesday, April 10th. JMP Securities reduced their price target on shares of Arbor Realty Trust from $19.00 to $17.00 and set a “market outperform” rating on the stock in a research note on Thursday, February 1st. Finally, Wedbush restated a “neutral” rating and set a $13.00 price target on shares of Arbor Realty Trust in a research note on Monday, May 6th. Two research analysts have rated the stock with a sell rating, three have assigned a hold rating and two have given a buy rating to the stock. According to data from MarketBeat, the stock presently has a consensus rating of “Hold” and a consensus price target of $14.71. View Our Latest Research Report on ABR Arbor Realty Trust Company Profile (Free Report) Arbor Realty Trust, Inc invests in a diversified portfolio of structured finance assets in the multifamily, single-family rental, and commercial real estate markets in the United States. The company operates through Structured Business and Agency Business segments. It primarily invests in bridge and mezzanine loans, including junior participating interests in first mortgages, and preferred and direct equity, as well as real estate-related joint ventures, real estate-related notes, and various mortgage-related securities.
- 05/20/2024
|
Natixis Advisors L.P. Cuts Holdings in Core Laboratories Inc. (NYSE:CLB)
- Natixis Advisors L.P. decreased its position in Core Laboratories Inc. (NYSE:CLB – Free Report) by 32.6% in the fourth quarter, according to its most recent Form 13F filing with the SEC. The institutional investor owned 12,928 shares of the oil and gas company’s stock after selling 6,265 shares during the period. Natixis Advisors L.P.’s holdings in Core Laboratories were worth $228,000 at the end of the most recent quarter. Other institutional investors and hedge funds also recently added to or reduced their stakes in the company. Allspring Global Investments Holdings LLC purchased a new position in Core Laboratories in the third quarter valued at $31,000. GAMMA Investing LLC purchased a new stake in shares of Core Laboratories during the fourth quarter worth about $48,000. PNC Financial Services Group Inc. increased its stake in shares of Core Laboratories by 72.7% during the third quarter. PNC Financial Services Group Inc. now owns 6,017 shares of the oil and gas company’s stock worth $144,000 after purchasing an additional 2,533 shares in the last quarter. Zurcher Kantonalbank Zurich Cantonalbank increased its stake in shares of Core Laboratories by 31.2% during the third quarter. Zurcher Kantonalbank Zurich Cantonalbank now owns 10,787 shares of the oil and gas company’s stock worth $259,000 after purchasing an additional 2,566 shares in the last quarter. Finally, Ballentine Partners LLC purchased a new stake in shares of Core Laboratories during the fourth quarter worth about $288,000. Hedge funds and other institutional investors own 97.81% of the company’s stock. Core Laboratories Stock Performance CLB opened at $18.04 on Monday. The firm has a market capitalization of $846.08 million, a PE ratio of 20.50, a PEG ratio of 1.02 and a beta of 2.40. Core Laboratories Inc. has a twelve month low of $13.82 and a twelve month high of $27.94. The firm’s 50-day moving average price is $16.89 and its 200 day moving average price is $16.88. The company has a current ratio of 2.68, a quick ratio of 1.85 and a debt-to-equity ratio of 0.68. Core Laboratories (NYSE:CLB – Get Free Report) last posted its earnings results on Wednesday, April 24th. The oil and gas company reported $0.13 earnings per share for the quarter, beating the consensus estimate of $0.11 by $0.02. The company had revenue of $129.64 million for the quarter, compared to analyst estimates of $124.47 million. Core Laboratories had a net margin of 8.18% and a return on equity of 15.71%. As a group, sell-side analysts expect that Core Laboratories Inc. will post 0.8 EPS for the current fiscal year. Core Laboratories Announces Dividend The company also recently announced a quarterly dividend, which will be paid on Tuesday, May 28th. Shareholders of record on Monday, May 6th will be issued a $0.01 dividend. The ex-dividend date of this dividend is Friday, May 3rd. This represents a $0.04 annualized dividend and a yield of 0.22%. Core Laboratories’s payout ratio is 4.55%. Wall Street Analysts Forecast Growth A number of analysts have recently commented on CLB shares. Stifel Nicolaus boosted their target price on shares of Core Laboratories from $17.00 to $18.00 and gave the stock a “hold” rating in a research note on Friday, April 26th. Bank of America lowered their price target on shares of Core Laboratories from $17.00 to $16.00 and set an “underperform” rating on the stock in a research report on Monday, April 15th. Two investment analysts have rated the stock with a sell rating and three have issued a hold rating to the company’s stock. Based on data from MarketBeat, the company has an average rating of “Hold” and a consensus target price of $18.75. Check Out Our Latest Report on Core Laboratories About Core Laboratories (Free Report) Core Laboratories Inc provides reservoir description and production enhancement services and products to the oil and gas industry in the United States, and internationally. It operates through Reservoir Description and Production Enhancement segments. The Reservoir Description segment includes the characterization of petroleum reservoir rock and reservoir fluid samples to enhance production and improve recovery of crude oil and gas from its clients' reservoirs.
- 05/20/2024
|
Tandem Diabetes Care, Inc. (NASDAQ:TNDM) Shares Sold by Swiss National Bank
- Swiss National Bank reduced its position in Tandem Diabetes Care, Inc. (NASDAQ:TNDM – Free Report) by 9.7% in the 4th quarter, according to its most recent disclosure with the Securities and Exchange Commission. The firm owned 128,200 shares of the medical device company’s stock after selling 13,800 shares during the quarter. Swiss National Bank owned about 0.20% of Tandem Diabetes Care worth $3,792,000 at the end of the most recent reporting period. A number of other hedge funds have also modified their holdings of the business. RiverPark Advisors LLC acquired a new stake in Tandem Diabetes Care during the 4th quarter worth $27,000. Signaturefd LLC raised its stake in Tandem Diabetes Care by 871.8% during the 4th quarter. Signaturefd LLC now owns 1,691 shares of the medical device company’s stock valued at $50,000 after acquiring an additional 1,517 shares during the last quarter. GAMMA Investing LLC acquired a new stake in Tandem Diabetes Care during the 4th quarter worth approximately $73,000. PNC Financial Services Group Inc. grew its stake in shares of Tandem Diabetes Care by 51.7% in the 3rd quarter. PNC Financial Services Group Inc. now owns 3,226 shares of the medical device company’s stock valued at $67,000 after purchasing an additional 1,099 shares during the last quarter. Finally, Creative Financial Designs Inc. ADV acquired a new position in shares of Tandem Diabetes Care in the fourth quarter valued at approximately $104,000. Analyst Upgrades and Downgrades A number of research firms recently weighed in on TNDM. Piper Sandler restated an “overweight” rating and issued a $50.00 price target (up from $35.00) on shares of Tandem Diabetes Care in a research note on Friday, May 3rd. Leerink Partnrs upgraded shares of Tandem Diabetes Care from a “market perform” rating to an “outperform” rating in a research report on Thursday, April 25th. SVB Leerink upgraded shares of Tandem Diabetes Care from a “market perform” rating to an “outperform” rating and lifted their price target for the company from $34.00 to $45.00 in a research report on Thursday, April 25th. Citigroup upped their price target on Tandem Diabetes Care from $31.00 to $38.00 and gave the stock a “neutral” rating in a report on Wednesday, April 3rd. Finally, Stifel Nicolaus lifted their price objective on Tandem Diabetes Care from $37.00 to $40.00 and gave the stock a “buy” rating in a report on Tuesday, April 23rd. Three equities research analysts have rated the stock with a hold rating and eight have given a buy rating to the company’s stock. Based on data from MarketBeat, Tandem Diabetes Care presently has a consensus rating of “Moderate Buy” and an average target price of $43.80. Check Out Our Latest Analysis on Tandem Diabetes Care Tandem Diabetes Care Stock Performance NASDAQ TNDM opened at $47.30 on Monday. Tandem Diabetes Care, Inc. has a twelve month low of $13.82 and a twelve month high of $47.88. The business’s 50-day moving average price is $35.59 and its 200 day moving average price is $28.04. The company has a current ratio of 3.81, a quick ratio of 3.01 and a debt-to-equity ratio of 1.43. The company has a market capitalization of $3.06 billion, a PE ratio of -21.80 and a beta of 1.10. Tandem Diabetes Care (NASDAQ:TNDM – Get Free Report) last issued its quarterly earnings results on Wednesday, February 21st. The medical device company reported ($0.27) EPS for the quarter, missing the consensus estimate of ($0.23) by ($0.04). The company had revenue of $196.80 million for the quarter, compared to analyst estimates of $204.86 million. Tandem Diabetes Care had a negative return on equity of 34.38% and a negative net margin of 18.37%. On average, research analysts predict that Tandem Diabetes Care, Inc. will post -1.7 earnings per share for the current year. Tandem Diabetes Care Profile (Free Report) Tandem Diabetes Care, Inc, a medical device company, designs, develops, and commercializes technology solutions for people living with diabetes in the United States and internationally. The company's flagship product is the t:slim X2 insulin delivery system, a pump platform for managing insulin delivery and display continuous glucose monitoring sensor information directly on the pump home screen; and Tandem Mobi insulin pump, an automated insulin delivery system.
- 05/20/2024
|
Swiss National Bank Sells 9,000 Shares of Envestnet, Inc. (NYSE:ENV)
- Swiss National Bank lessened its holdings in shares of Envestnet, Inc. (NYSE:ENV – Free Report) by 10.0% during the 4th quarter, according to its most recent filing with the Securities and Exchange Commission. The firm owned 80,700 shares of the business services provider’s stock after selling 9,000 shares during the quarter. Swiss National Bank owned about 0.15% of Envestnet worth $3,996,000 at the end of the most recent quarter. Other large investors also recently added to or reduced their stakes in the company. Headlands Technologies LLC purchased a new stake in Envestnet during the 3rd quarter valued at approximately $45,000. PNC Financial Services Group Inc. increased its holdings in Envestnet by 19.4% in the 3rd quarter. PNC Financial Services Group Inc. now owns 4,930 shares of the business services provider’s stock valued at $217,000 after acquiring an additional 802 shares during the last quarter. Tower Research Capital LLC TRC lifted its stake in Envestnet by 75.3% in the 3rd quarter. Tower Research Capital LLC TRC now owns 6,788 shares of the business services provider’s stock worth $299,000 after purchasing an additional 2,915 shares in the last quarter. Quantbot Technologies LP bought a new position in shares of Envestnet during the 3rd quarter valued at about $420,000. Finally, Truist Financial Corp purchased a new position in shares of Envestnet during the fourth quarter valued at about $433,000. Insider Buying and Selling at Envestnet In other news, insider Matthew Majoros sold 700 shares of the stock in a transaction that occurred on Monday, March 25th. The shares were sold at an average price of $56.92, for a total transaction of $39,844.00. Following the transaction, the insider now directly owns 15,212 shares in the company, valued at $865,867.04. The transaction was disclosed in a legal filing with the SEC, which is available through the SEC website. In related news, Director Lauren Taylor Wolfe acquired 1,670 shares of the company’s stock in a transaction that occurred on Friday, March 15th. The shares were bought at an average price of $52.99 per share, with a total value of $88,493.30. Following the completion of the transaction, the director now directly owns 4,188,871 shares in the company, valued at $221,968,274.29. The acquisition was disclosed in a document filed with the Securities & Exchange Commission, which can be accessed through the SEC website. Also, insider Matthew Majoros sold 700 shares of the stock in a transaction dated Monday, March 25th. The shares were sold at an average price of $56.92, for a total transaction of $39,844.00. Following the sale, the insider now directly owns 15,212 shares of the company’s stock, valued at $865,867.04. The disclosure for this sale can be found here. Insiders own 8.90% of the company’s stock. Envestnet Price Performance ENV opened at $67.81 on Monday. The business has a fifty day moving average of $60.10 and a 200 day moving average of $51.46. The stock has a market cap of $3.74 billion, a P/E ratio of -19.05 and a beta of 1.26. The company has a quick ratio of 1.19, a current ratio of 1.19 and a debt-to-equity ratio of 1.47. Envestnet, Inc. has a 52-week low of $33.12 and a 52-week high of $68.83. Envestnet (NYSE:ENV – Get Free Report) last announced its quarterly earnings data on Thursday, February 22nd. The business services provider reported $0.43 earnings per share for the quarter, beating analysts’ consensus estimates of $0.33 by $0.10. The company had revenue of $317.63 million during the quarter, compared to analyst estimates of $312.24 million. Envestnet had a negative net margin of 15.33% and a positive return on equity of 14.75%. As a group, sell-side analysts anticipate that Envestnet, Inc. will post 1.78 EPS for the current year. Wall Street Analyst Weigh In ENV has been the subject of a number of research reports. Jefferies Financial Group raised Envestnet from an “underperform” rating to a “hold” rating and increased their price target for the company from $47.00 to $59.00 in a research note on Wednesday, May 8th. DA Davidson lifted their price objective on shares of Envestnet from $62.00 to $67.00 and gave the stock a “buy” rating in a research note on Tuesday, April 2nd. JPMorgan Chase & Co. upped their target price on shares of Envestnet from $44.00 to $45.00 and gave the company a “neutral” rating in a research report on Friday, February 23rd. Raymond James lifted their price target on Envestnet from $52.00 to $60.00 and gave the stock an “outperform” rating in a research report on Tuesday, April 2nd. Finally, Royal Bank of Canada boosted their target price on Envestnet from $56.00 to $64.00 and gave the company a “sector perform” rating in a research report on Wednesday, May 8th. Four investment analysts have rated the stock with a hold rating and five have issued a buy rating to the company’s stock. According to data from MarketBeat, the company presently has an average rating of “Moderate Buy” and a consensus price target of $64.14. Check Out Our Latest Analysis on Envestnet Envestnet Company Profile (Free Report) Envestnet, Inc, through its subsidiaries, provides wealth management software and services in the United States and internationally. It operates through two segments: Envestnet Wealth Solutions and Envestnet Data & Analytics. The Envestnet Wealth Solutions segment offers Envestnet | Enterprise, an end-to-end open architecture wealth management platform, as well as offers data aggregation and reporting, data analytics, and digital advice capabilities; Envestnet | Wealth Analytics that transforms data into actionable intelligence; Envestnet | Tamarac which provides trading, rebalancing, portfolio accounting, performance reporting, and client relationship management software; and Envestnet | MoneyGuide that provides goals-based financial planning solutions to the financial services industry.
- 05/20/2024
|
Camtek Ltd. (NASDAQ:CAMT) Stake Lowered by Swiss National Bank
- Swiss National Bank cut its stake in Camtek Ltd. (NASDAQ:CAMT – Free Report) by 10.3% during the fourth quarter, according to its most recent disclosure with the Securities and Exchange Commission. The fund owned 57,537 shares of the semiconductor company’s stock after selling 6,593 shares during the quarter. Swiss National Bank owned approximately 0.13% of Camtek worth $4,053,000 as of its most recent filing with the Securities and Exchange Commission. Other institutional investors have also recently bought and sold shares of the company. Optimum Investment Advisors lifted its holdings in shares of Camtek by 15.0% during the 4th quarter. Optimum Investment Advisors now owns 1,725 shares of the semiconductor company’s stock valued at $120,000 after buying an additional 225 shares during the last quarter. PNC Financial Services Group Inc. grew its position in Camtek by 431.5% in the third quarter. PNC Financial Services Group Inc. now owns 1,940 shares of the semiconductor company’s stock worth $121,000 after acquiring an additional 1,575 shares in the last quarter. C M Bidwell & Associates Ltd. increased its stake in shares of Camtek by 3,062.2% during the 3rd quarter. C M Bidwell & Associates Ltd. now owns 2,846 shares of the semiconductor company’s stock worth $177,000 after purchasing an additional 2,756 shares during the last quarter. WINTON GROUP Ltd bought a new position in shares of Camtek during the 3rd quarter valued at $207,000. Finally, Commonwealth Equity Services LLC acquired a new stake in shares of Camtek in the 3rd quarter valued at $267,000. Institutional investors and hedge funds own 41.93% of the company’s stock. Camtek Price Performance Shares of NASDAQ:CAMT opened at $97.10 on Monday. The firm has a market capitalization of $4.36 billion, a PE ratio of 54.86, a PEG ratio of 3.22 and a beta of 1.39. The company has a current ratio of 3.66, a quick ratio of 3.08 and a debt-to-equity ratio of 0.44. Camtek Ltd. has a 1-year low of $27.14 and a 1-year high of $100.95. The business’s 50 day moving average is $82.62 and its 200-day moving average is $75.25. Camtek (NASDAQ:CAMT – Get Free Report) last posted its quarterly earnings results on Tuesday, February 20th. The semiconductor company reported $0.57 earnings per share for the quarter, topping analysts’ consensus estimates of $0.53 by $0.04. The firm had revenue of $88.70 million for the quarter, compared to the consensus estimate of $88.02 million. Camtek had a net margin of 25.35% and a return on equity of 20.94%. The business’s revenue was up 7.9% compared to the same quarter last year. During the same quarter in the previous year, the company earned $0.45 earnings per share. Sell-side analysts predict that Camtek Ltd. will post 2.19 earnings per share for the current year. Camtek Announces Dividend The business also recently disclosed a Variable dividend, which was paid on Thursday, April 18th. Shareholders of record on Thursday, April 4th were issued a dividend of $1.33 per share. The ex-dividend date was Wednesday, April 3rd. Camtek’s payout ratio is 75.14%. Analyst Upgrades and Downgrades Several equities analysts have weighed in on the company. Needham & Company LLC raised their target price on Camtek from $92.00 to $106.00 and gave the company a “buy” rating in a report on Friday, May 10th. Northland Capmk lowered Camtek from a “strong-buy” rating to a “hold” rating in a report on Thursday. Jefferies Financial Group began coverage on Camtek in a report on Monday, May 13th. They set a “buy” rating and a $120.00 price target on the stock. B. Riley reaffirmed a “buy” rating and set a $110.00 price objective (up from $102.00) on shares of Camtek in a report on Friday, May 10th. Finally, Northland Securities lowered Camtek from an “outperform” rating to a “market perform” rating in a research note on Thursday. Three analysts have rated the stock with a hold rating and seven have assigned a buy rating to the company. According to data from MarketBeat, the stock has a consensus rating of “Moderate Buy” and a consensus price target of $90.50. Read Our Latest Stock Report on CAMT Camtek Profile (Free Report) Camtek Ltd., together with its subsidiaries, develops, manufactures, and sells inspection and metrology equipment for semiconductor industry. The company provides Eagle-i, a system that delivers 2D inspection and metrology capabilities; Eagle-AP, which addresses the advanced packaging market using software and hardware technologies that deliver superior 2D and 3D inspection and metrology capabilities on the same platform; and Golden Eagle, a panel inspection and metrology system to address the challenges fanout wafer level packaging applications. See Also Five stocks we like better than Camtek 3 Stocks to Consider Buying in October MarketBeat Week in Review – 5/13 – 5/17 3 Stocks to Protect Your Portfolio from the Coronavirus Contagion Take-Two Interactive Software Offers 2nd Chance for Investors Asset Allocation: The Key to a Successful Portfolio. Are You Paying Attention to Yours? Deere & Company’s Q2 Report: Strong Revenue, Cautious Outlook
- 05/20/2024
|
Q2 2024 EPS Estimates for PSQ Holdings, Inc. Reduced by Roth Capital (NYSE:PSQH)
- PSQ Holdings, Inc. (NYSE:PSQH – Free Report) – Equities researchers at Roth Capital cut their Q2 2024 EPS estimates for shares of PSQ in a report released on Thursday, May 16th. Roth Capital analyst D. Aftahi now forecasts that the company will post earnings per share of ($0.30) for the quarter, down from their previous estimate of ($0.26). Roth Capital also issued estimates for PSQ’s Q3 2024 earnings at ($0.28) EPS, Q4 2024 earnings at ($0.24) EPS, Q1 2025 earnings at ($0.24) EPS, Q2 2025 earnings at ($0.22) EPS, Q3 2025 earnings at ($0.20) EPS, Q4 2025 earnings at ($0.17) EPS and FY2025 earnings at ($0.83) EPS. Separately, Roth Mkm reissued a “buy” rating and issued a $7.50 price target (down previously from $8.50) on shares of PSQ in a research report on Thursday. View Our Latest Stock Report on PSQH PSQ Stock Performance Shares of PSQH stock opened at $3.81 on Monday. The company has a quick ratio of 4.93, a current ratio of 1.50 and a debt-to-equity ratio of 0.46. PSQ has a 52 week low of $3.66 and a 52 week high of $35.57. The stock has a market capitalization of $107.77 million, a PE ratio of -0.16 and a beta of 0.45. The firm has a 50 day moving average of $4.50 and a two-hundred day moving average of $5.02. PSQ (NYSE:PSQH – Get Free Report) last issued its quarterly earnings results on Thursday, March 14th. The company reported ($0.40) EPS for the quarter, beating the consensus estimate of ($0.47) by $0.07. PSQ had a negative net margin of 674.94% and a negative return on equity of 762.28%. The company had revenue of $2.75 million during the quarter, compared to analysts’ expectations of $2.47 million. Institutional Investors Weigh In On PSQ Institutional investors have recently modified their holdings of the company. PNC Financial Services Group Inc. acquired a new stake in PSQ during the 3rd quarter worth $27,000. Mariner LLC acquired a new stake in PSQ during the 3rd quarter worth $1,571,000. Capital Investment Counsel Inc acquired a new stake in PSQ during the 4th quarter worth $60,000. Axxcess Wealth Management LLC acquired a new stake in PSQ during the 3rd quarter worth $12,713,000. Finally, Calton & Associates Inc. acquired a new stake in PSQ during the 4th quarter worth $431,000. 17.32% of the stock is owned by hedge funds and other institutional investors. PSQ Company Profile (Get Free Report) PSQ Holdings, Inc, together with its subsidiaries, operates an online marketplace through advertising and eCommerce in the United States. It operates through two segments, Marketplace and Brands segments. The PSQ platform is accessible through its mobile application and website. The company also sells diapers and wipes to mothers online under the EveryLife brand name.
- 05/20/2024
|
Goldman (GS) Plans to Expand Private Equity Credit Lines
- The Goldman Sachs Group, Inc. (GS Quick QuoteGS - Free Report) plans to ramp up its lending services to private equity and asset managers, per Reuters. The bank also intends to expand internationally, filling the gaps created by the problems at regional banks and the recent sale of Credit Suisse.The private equity market has a strong potential to grow as private equity deals are expected to rise, driven by record-high fundraising. These loans are classified as short-term, typically secured by the assets of the borrowing firms and hence have a lesser risk attached to them. Hence, GS’ focus on the private equity market is a strategic fit.Asset-secured lending will allow GS to expand its financing business in fixed income, currency and commodities (FICC) and equities space. The move is in line with the company’s key focus on enhancing the stability of revenue generation in its global banking and markets divisions.In the past to seven years, Goldman's deposit base experienced tremendous growth. The bank is actively seeking to align its asset growth with this expansion. In 2023, GS took over a loan portfolio worth $15 billion from the failed Signature bank. This portfolio included loans to private equity firms and venture capital funds, which is a crucial part of its client base. These loans help manage a smooth flow of working capital for the bank, also known as capital call facilities or subscription line loans. Once Goldman strengthened its operations in the United States, the bank plans to expand its lending into Europe, the U.K. and Asia. They have already added staff in its Dallas and Bangalore offices to handle these loans.Markedly, Goldman decided to refocus on its core strengths of IB and trading operations while scaling back its consumer banking footprint and hence undertook a major business restructuring initiative. In first-quarter 2024, the company completed the sale of GreenSky, its home-improvement lending platform, to a consortium of investors. In second-half 2023, it sold its Personal Financial Management unit to Creative Planning. These are in line with its decision to focus on and grow core businesses where it showcased encouraging results given its strong leadership position, wide scale of operations and exceptional talent.In the past six months, the company’s shares have rallied 39.6% compared with the industry’s growth of 35.8%.Image Source: Zacks Investment ResearchGS currently sports a Zacks Rank #1 (Strong Buy). Apart from GS, major banks like JPMorgan Chase & Co. (JPM Quick QuoteJPM - Free Report) and The PNC Financial Services Group, Inc. (PNC Quick QuotePNC - Free Report) are also increasing their participation in the market worth $800 billion to $1 trillion. Also, JPM stepped up its lending functions after it acquired First Republic Bank in 2023. Similarly, in October 2023, PNC acquired loan commitments from Signature Bank worth approximately $16 billion. These efforts to further grow its loan balances are expected to offer support to the banks’ financials in the long run. Zacks Names "Single Best Pick to Double" From thousands of stocks, 5 Zacks experts each have chosen their favorite to skyrocket +100% or more in months to come. From those 5, Director of Research Sheraz Mian hand-picks one to have the most explosive upside of all. It’s a little-known chemical company that’s up 65% over last year, yet still dirt cheap. With unrelenting demand, soaring 2022 earnings estimates, and $1.5 billion for repurchasing shares, retail investors could jump in at any time. This company could rival or surpass other recent Zacks’ Stocks Set to Double like Boston Beer Company which shot up +143.0% in little more than 9 months and NVIDIA which boomed +175.9% in one year.Free: See Our Top Stock and 4 Runners Up >>
- 05/20/2024
|
The PNC Financial Services Group (PNC) Up 9.6% Since Last Earnings Report: Can It Continue?
- The PNC Financial Services Group (PNC) reported earnings 30 days ago. What's next for the stock?
- 05/16/2024
|
PNC Executives To Speak At Bernstein Conference
- PITTSBURGH , May 15, 2024 /PRNewswire/ -- The PNC Financial Services Group, Inc. (NYSE: PNC) announced today that Chairman and Chief Executive Officer William S. Demchak and Executive Vice President and Chief Financial Officer Robert Q.
- 05/15/2024
|
PNC Financial (PNC) Launches Credit Card With Cashback Feature
- PNC Financial (PNC) unveils its new PNC Cash Unlimited Visa Signature credit card. It is set to offer the bank a competitive edge over its peers.
- 05/09/2024
|
PNC Financial (PNC), TCW Partner for Private Credit Platform
- PNC Financial (PNC) partners with TCW to offer private credit solutions to middle-market companies. This will help it tap into the expanding private credit market.
- 05/07/2024
|
PNC Bank Introduces New Cash Unlimited Visa Signature® Credit Card Offering 2% Cash Back Across All Eligible Purchases
- Embracing simplicity and competitive value, the new card delivers a suite of benefits that help meet today's consumer needs PITTSBURGH , May 7, 2024 /PRNewswire/ -- PNC Bank announced today the launch of its newest credit card, the PNC Cash Unlimited® Visa Signature credit card. The bank's latest credit card is designed to provide straightforward, valuable rewards to its cardholders with an unlimited 2% cash back on all eligible purchases.
- 05/07/2024
|
TCW-PNC Platform Sets $2.5 Billion Private-Credit Goal
- PNC Financial Services Group Inc.'s partnership with TCW Group Inc. to create a private-credit platform gives the bank a way to hold onto business that it might otherwise have had to send elsewhere, Bloomberg's John Sage tells Sonali Basak on "Bloomberg Markets." The platform seeks to have $2.5 billion in its first year.
- 05/06/2024
|
PNC and TCW Partner on Loans to Middle Market Companies
- The PNC Financial Services Group and the TCW Group have formalized and expanded their partnership to develop a private credit platform focused on middle market lending. The companies aim to have $2.
- 05/06/2024
|
PNC, TCW Partner on Middle-Market Private Credit Platform
- TCW Group is teaming up with PNC Financial Services Group on a private credit platform aimed at middle-market companies, targeting to have $2.5 billion in its first year. Sonali Basak reports on Bloomberg Television.
- 05/06/2024
|
PNC, TCW Partner To Expand Capabilities, Create Private Credit Platform
- New Strategy Creates Opportunity for Significant Expansion in Middle Market Lending PITTSBURGH and LOS ANGELES , May 6, 2024 /PRNewswire/ -- The PNC Financial Services Group, Inc. ("PNC"), one of the largest diversified financial institutions in the U.S., and the TCW Group, Inc. ("TCW"), a leading global asset manager, today announced they are partnering to deliver private credit solutions to middle market companies. The PNC and TCW partnership formalizes and expands more than 15 years of collaboration between PNC and TCW, combining both institutions' credit expertise: TCW's 23-year track record of successfully originating, underwriting and managing direct lending portfolios; and the strengths of PNC's national client relationships and its leading middle market lending franchise.
- 05/06/2024
|
President Muizzu's Party Wins Maldives Polls. What This Means For India
- In what could potentially harden Maldives president Mohamed Muizzu's pro-China stance, his party, the People's National Congress (PNC), has scored a thumping victory in the island nation's parliamentary election held yesterday...
- 04/22/2024
|
Banks are well positioned for CRE concerns, says Baird's David George
- David George, Baird bank analyst, joins 'Closing Bell' to discuss the banking sector and which banks he's looking at as winners in the sector.
- 04/19/2024
|
PNC Reports 2% Commercial Loan Dip Amid Manufacturer ‘Hesitancy'
- PNC Financial Services Group saw average commercial loans dip in the first quarter as businesses remained cautious about the macroeconomic environment. Overall, average loans decreased 1%.
- 04/16/2024
|
The PNC Financial Services Group, Inc. (PNC) Q1 2024 Earnings Call Transcript
- The PNC Financial Services Group, Inc. (PNC) Q1 2024 Earnings Call Transcript
- 04/16/2024
|
PNC Financial (PNC) Q1 Earnings Beat Estimates, Costs Rise
- PNC Financial's (PNC) Q1 earnings reflect an improvement in deposit balances, alongside lower provisions. However, challenges emerge with lower net interest income and higher expenses.
- 04/16/2024
|
Big banks led by Citi continue layoffs amid pressure to cut costs
- U.S. banking giants continued to shed employees in the first quarter, with Citigroup seeing the biggest drop.
- 04/16/2024
|
PNC CEO on Q1 earnings beat
- PNC CEO Bill Demchak joins 'Money Movers' to discuss the stock reaction to PNC's quarterly earnings results, how the company is adjusting to headwinds, and the company's cost efforts.
- 04/16/2024
|
PNC Stock Slips After Q1 Profit and Revenue Slide
- PNC Financial Services Group (PNC) shares lost ground Tuesday as the bank posted a big drop in first-quarter profit and revenue, and offered soft guidance.PNC reported first-quarter net income fell 21% year-over-year to $1.34 billion, although adjusted earnings per share (EPS) of $3.36 exceeded estimates. Revenue declined 8% to $5.15 billion, short of forecasts.
- 04/16/2024
|
The PNC Financial Services Group (PNC) Reports Q1 Earnings: What Key Metrics Have to Say
- While the top- and bottom-line numbers for The PNC Financial Services Group (PNC) give a sense of how the business performed in the quarter ended March 2024, it could be worth looking at how some of its key metrics compare to Wall Street estimates and year-ago values.
- 04/16/2024
|
The PNC Financial Services Group, Inc (PNC) Q1 Earnings Surpass Estimates
- The PNC Financial Services Group, Inc (PNC) came out with quarterly earnings of $3.36 per share, beating the Zacks Consensus Estimate of $3.09 per share. This compares to earnings of $3.98 per share a year ago.
- 04/16/2024
|
PNC Stock Is Edging Lower. Earnings Beat, but Revenue Disappointed.
- Regional bank PNC Financial reported first-quarter earnings and revenue both slipped from a year ago.
- 04/16/2024
|
Should You Buy PNC Financial (PNC) Ahead of Earnings?
- PNC Financial (PNC) is seeing favorable earnings estimate revision activity and has a positive Zacks Earnings ESP heading into earnings season.
- 04/15/2024
|
5 U.S. Bigwigs Likely to Gain on Q1 Earnings Beat This Week
- We have narrowed our search to five large-cap stocks that are poised to beat on earnings results this week. These are: BAC, JNJ, UAL, PNC, BK.
- 04/15/2024
|
Exploring Analyst Estimates for The PNC Financial Services Group (PNC) Q1 Earnings, Beyond Revenue and EPS
- Get a deeper insight into the potential performance of The PNC Financial Services Group (PNC) for the quarter ended March 2024 by going beyond Wall Street's top -and-bottom-line estimates and examining the estimates for some of its key metrics.
- 04/11/2024
|
PNC Financial's (PNC) Strategic Actions Aid as Costs Rise
- PNC Financial (PNC) benefits from strategic buyouts, and solid loan and deposit growth. However, rising expenses and a lack of loan portfolio diversification are major woes.
- 04/10/2024
|
The PNC Financial Services Group, Inc (PNC) Expected to Beat Earnings Estimates: Should You Buy?
- The PNC Financial Services Group (PNC) possesses the right combination of the two key ingredients for a likely earnings beat in its upcoming report. Get prepared with the key expectations.
- 04/09/2024
|
3 Consumer Staples Stocks Setting up for a Breakout
- The swing is coming in this next market cycle. While markets may have priced in potential interest rate cuts from the Federal Reserve (the Fed), some stocks have yet to reach their full potential.
- 04/08/2024
|
Banks Think Small Cap Stocks Need to Catch Up: 3 Winners
- The momentum trade has been exhausted by the large-capitalization stocks in the market, especially those in the technology sector, as names like Nvidia Co. NASDAQ: NVDA keep making new all-time highs. For this reason, quants at PGIM believe that Wall Street may soon rotate into small-capitalization stocks to squeeze further returns.
- 04/03/2024
|
Wells Fargo, JPMorgan named top picks by Goldman Sachs for potential first-quarter upside surprise
- JPMorgan Chase & Co. and Wells Fargo & Co. both ranked as top picks on Tuesday among the seven large-bank stocks covered by Goldman Sachs analysts.
- 04/02/2024
|
Will The PNC Financial Services Group (PNC) Beat Estimates Again in Its Next Earnings Report?
- The PNC Financial Services Group (PNC) has an impressive earnings surprise history and currently possesses the right combination of the two key ingredients for a likely beat in its next quarterly report.
- 04/02/2024
|
3 Value Stocks Too Small For Buffett's Portfolio
- When investment giants like Warren Buffett spot the rare opportunity to buy a value stock, they more than often pass on the chance. Because they manage such large amounts of capital, investing less than a few billion in companies isn't big enough to bring them returns.
- 03/28/2024
|
3 Cheap Stocks That Shouldn't Be Cheap for Long
- Earnings growth typically drives stock prices. Three stocks are set to grow at double and even triple-digit rates this year, yet their prices stay at more than 30% discounts from their 52-week highs.
- 03/26/2024
|
PNC Bank CEO: Banking is in an uncertain position with rates
- PNC Bank CEO Bill Demchak joins Bloomberg TV and Radio and breaks down what he sees as the areas of strength and weakness for the banking industry. Get more on the Bloomberg Businessweek Podcast Apple: http://bit.ly/3IPl60i Spotify: http://bit.ly/3WGFd6B Anywhere: http://bit.ly/42xo9kZ
- 03/22/2024
|
3 Laggard Stocks Ready to Join the Market's High-Flying Club
- With major stock markets reaching new highs in Q1, some investors are looking for stocks to buy to exploit the lack of “breadth”. A small number of large-cap stocks with significant weightings have propelled upward movement, while many stocks have underperformed despite a rising market.
- 03/19/2024
|
3 Regional Bank Stocks Ready to Rebound and Reward Bold Investors
- According to Barron's, the recent decline in many regional bank stocks, caused by New York Community Bancorp's (NYSE: NYCB ) multitude of problems, appears to have created a good buying opportunity for investors within the sector. Investment bank Keefe, Bruyette & Woods says that, despite NYCB's issues, just three regional banks of roughly 4,700 experienced any major difficulties in 2023.
- 03/19/2024
|
The PNC Financial Services Group, Inc (PNC) Ascends While Market Falls: Some Facts to Note
- The latest trading day saw The PNC Financial Services Group, Inc (PNC) settling at $152.84, representing a +1.67% change from its previous close.
- 03/11/2024
|
PNC Financial (PNC) to Incur Additional $130M in FDIC Fees in Q1
- Owing to a revision in FDIC's estimated losses, PNC Financial (PNC) expects to incur an additional $130 million in assessment fees on a pre-tax basis in the first quarter.
- 03/06/2024
|
The PNC Financial Services Group Announces First Quarter 2024 Earnings Conference Call, Virtual-Only Annual Shareholders Meeting Details
- PITTSBURGH , March 5, 2024 /PRNewswire/ -- The PNC Financial Services Group, Inc. (NYSE: PNC) expects to issue financial results for the first quarter of 2024 at approximately 6:45 a.m. (ET), Tuesday, April 16, as previously announced.
- 03/05/2024
|
The PNC Financial Services Group, Inc (PNC) Moves 4.0% Higher: Will This Strength Last?
- The PNC Financial Services Group, Inc (PNC) witnessed a jump in share price last session on above-average trading volume. The latest trend in earnings estimate revisions for the stock suggests that there could be more strength down the road.
- 03/05/2024
|
20 GARP Blue-Chip Bargains To Buy Now
- Last week saw a rally in Nvidia stock, causing nervousness among value and income investors. There were opportunities to buy quality companies at good or even great valuations even during the tech bubble. Growth at a reasonable price (GARP) is one potential time-tested way to beat the market long term. Super GARP investing, combining GARP with quality screens, could be better.
- 03/01/2024
|
The PNC Financial Services Group, Inc (PNC) Suffers a Larger Drop Than the General Market: Key Insights
- In the most recent trading session, The PNC Financial Services Group, Inc (PNC) closed at $144.85, indicating a -0.87% shift from the previous trading day.
- 02/26/2024
|
Bank branches are not going away even if consumers mostly use apps
- Banks may have cut back on some of their branches, but maintaining a retail presence remains a priority even in the age of the smartphone.
- 02/23/2024
|
PNC Financial (PNC) Lowers Q1 NII View on Soft Loan Growth
- PNC Financial (PNC) softens its Q1 NII guidance due to lower-than-expected average loan growth and a slower increase in utilization rates.
- 02/22/2024
|
Here's Why The PNC Financial Services Group, Inc (PNC) Fell More Than Broader Market
- The PNC Financial Services Group, Inc (PNC) reachead $146.70 at the closing of the latest trading day, reflecting a -1.44% change compared to its last close.
- 02/20/2024
|
Balance Sheet Strength Aids PNC Financial (PNC), High Costs Ail
- PNC Financials' (PNC) solid balance sheet and strategic initiatives will continue supporting its financials. However, a rise in costs will hurt.
- 02/20/2024
|
PNC Financial (PNC) Plans to Invest $1B in 100 New Branches
- PNC Financial (PNC) plans to invest $1 billion to open more than 100 branches by 2028. The company also aims to renovate above 1,200 locations.
- 02/15/2024
|
PNC Bank to Add 100 Locations, Renovate 1,200 Through 2028
- PNC Bank will invest $1 billion to open more than 100 new locations and renovate 1,200 existing ones through 2028. The bank currently has about 2,300 brick-and-mortar locations across the country, PNC Bank said in a Wednesday (Feb. 14) press release.
- 02/14/2024
|
PNC to spend $1B on its bank branches
- PNC Financial Services Group Inc. PNC said Wednesday it plans to spend $1 billion on its branch network. Plans include opening more than 100 new branches and renovating 1,200 out of a total network of 2,300 by the end of 2028.
- 02/14/2024
|
3 Financial Stocks to Sell as the Sector Faces Margin Pressure in 2024
- The United States banking sector had been in the spotlight in the first half of last year, as a series of events shook the industry and the markets. In March 2023, a wave of bond selloffs triggered by rising inflation expectations caused massive losses for banks holding long-term debt securities.
- 01/25/2024
|
The FDIC Assessed $16 Billion to Banks For Last Year's Banking Failures: Here's How Much the Big Banks Are Paying
- The failures of Silicon Valley Bank and First Republic Bank last year cost the Federal Deposit Insurance Corporation (FDIC) $18.7 billion. The FDIC imposed a special assessment on 114 financial institutions totaling $16.3 billion to recover lost funds.
- 01/22/2024
|
Not all regional banks are created equal, says Jim Cramer
- 'Mad Money' host Jim Cramer talks the state of regional banks and investing opportunities in the sector.
- 01/19/2024
|
PNC Financial (PNC) Q4 Earnings Beat on Lower Cost & Provisions
- PNC Financial's (PNC) Q4 earnings surpass estimates on decent expense-control efforts and a decline in provision for credit losses.
- 01/17/2024
|
PNC Net Loan Charge-Offs Rise 65%, Driven by Commercial Real Estate
- PNC Financial Services Group saw delinquencies, total non-performing loans (NPLs) and net loan charge-offs increase during the fourth quarter. One notable contributor to the increase was the commercial real estate (CRE) portfolio, Robert Q.
- 01/16/2024
|
The PNC Financial Services Group, Inc. (PNC) Q4 2023 Earnings Call Transcript
- The PNC Financial Services Group, Inc. (PNC) Q4 2023 Earnings Call Transcript
- 01/16/2024
|
Regulatory Fee, Layoff Expenses Drag Down PNC Profit
- Shares of PNC Financial Services Group Inc. (PNC) fell early Tuesday but later recovered as the bank's earnings slumped on a regulatory charge and costs for layoffs.
- 01/16/2024
|
PNC Financial's (PNC) Q4 Earnings Beat Estimates, Costs Up
- PNC Financial's (PNC) Q4 earnings gain from a rise in loan balances and an improvement in credit quality. However, higher expenses and lower NII act as headwinds.
- 01/16/2024
|
The PNC Financial Services Group, Inc (PNC) Reports Q4 Earnings: What Key Metrics Have to Say
- The headline numbers for The PNC Financial Services Group, Inc (PNC) give insight into how the company performed in the quarter ended December 2023, but it may be worthwhile to compare some of its key metrics to Wall Street estimates and the year-ago actuals.
- 01/16/2024
|
2 Bank Stocks Moving Lower After Earnings
- Bank earnings -- and earnings season in general -- kicked off on Friday and continued to start the holiday-shortened week.
- 01/16/2024
|
The PNC Financial Services Group, Inc (PNC) Surpasses Q4 Earnings and Revenue Estimates
- The PNC Financial Services Group, Inc (PNC) came out with quarterly earnings of $3.16 per share, beating the Zacks Consensus Estimate of $2.99 per share. This compares to earnings of $3.49 per share a year ago.
- 01/16/2024
|
PNC or NTRS: Which Is the Better Value Stock Right Now?
- Investors with an interest in Banks - Major Regional stocks have likely encountered both The PNC Financial Services Group, Inc (PNC) and Northern Trust Corporation (NTRS). But which of these two stocks presents investors with the better value opportunity right now?
- 01/12/2024
|
Here's Why Bank of America, PNC, and Wells Fargo Stock Surged Last Month
- The Federal Reserve suggested that interest rates might be slashed in 2024. This should stimulate demand for loans, relieve pressure on borrowers, and encourage investment banking activity.
- 01/10/2024
|
Unlocking Q4 Potential of The PNC Financial Services Group, Inc (PNC): Exploring Wall Street Estimates for Key Metrics
- Get a deeper insight into the potential performance of The PNC Financial Services Group, Inc (PNC) for the quarter ended December 2023 by going beyond Wall Street's top -and-bottom-line estimates and examining the estimates for some of its key metrics.
- 01/10/2024
|
Analysts Estimate The PNC Financial Services Group, Inc (PNC) to Report a Decline in Earnings: What to Look Out for
- The PNC Financial Services Group, Inc (PNC) doesn't possess the right combination of the two key ingredients for a likely earnings beat in its upcoming report. Get prepared with the key expectations.
- 01/09/2024
|
Key Factors to Affect PNC Financial (PNC) in Q4 Earnings
- PNC Financial's (PNC) Q4 earnings are expected to have been affected by moderate loan growth and higher costs. Low residential and commercial mortgage revenues are likely to have affected fee income.
- 01/08/2024
|
Here's Why The PNC Financial Services Group, Inc (PNC) Fell More Than Broader Market
- In the closing of the recent trading day, The PNC Financial Services Group, Inc (PNC) stood at $154.85, denoting a -0.5% change from the preceding trading day.
- 12/29/2023
|
6 Reasons To Avoid JPMorgan (JPM) Immediately
- Sponsored: Tips for Investing A financial advisor can help you understand the advantages and disadvantages of investment properties.
- 12/23/2023
|
The PNC Financial Services Group, Inc (PNC) Beats Stock Market Upswing: What Investors Need to Know
- In the most recent trading session, The PNC Financial Services Group, Inc (PNC) closed at $151.77, indicating a +1.4% shift from the previous trading day.
- 12/21/2023
|
PNC Financial: Margin Squeeze Offset By Dividend Income Potential (Ratings Downgrade)
- PNC Financial is downgraded from strong buy to Hold, agreeing with sentiment from SA analysts' consensus. Positives to mention are equity growth and strong 10-year dividend growth. Some headwinds include share price skyrocketing well above average this week, poor earnings and revenue growth impacted by net interest margin squeeze in current rate environment.
- 12/15/2023
|
Why Bank of America and PNC Stocks Crushed the Market Today
- An analyst upgraded his recommendations on no less than five banking stocks. He feels that the Fed gave the sector a major boost on Wednesday.
- 12/14/2023
|
10-Year Treasury Yield Breaks Key Level; These Stocks Are Huge Winners
- The 10-year Treasury yield undercut the key 4% level Wednesday night, continuing a huge retreat. Regional banks are big winners.
- 12/13/2023
|
The PNC Financial Services Group, Inc (PNC) Stock Sinks As Market Gains: Here's Why
- The latest trading day saw The PNC Financial Services Group, Inc (PNC) settling at $140.85, representing a -0.11% change from its previous close.
- 12/12/2023
|
Solid Balance Sheet Aids PNC Financial (PNC), High Costs Ail
- PNC Financials' (PNC) solid balance sheet and strategic initiatives will continue supporting its financials. However, a rise in costs will hurt.
- 12/08/2023
|
My 2023 Buy Rated Articles Beat The S&P 500 By Over 5%. My Current Top 5 Picks
- My 2023 buy rated articles beat the S&P 500 by an average of over 5%. Results are based on assumption that an equal sum was invested in each stock on the date the related article debuted. I focus on dividend payers and highlight five stocks as current top buys, including Alphabet, Discover Financial Services, Medtronic, Comcast, and PNC Financial.
- 12/08/2023
|
The PNC Financial Services Group, Inc (PNC) Ascends While Market Falls: Some Facts to Note
- In the closing of the recent trading day, The PNC Financial Services Group, Inc (PNC) stood at $139.36, denoting a +0.5% change from the preceding trading day.
- 12/06/2023
|
PNC sees growth opportunity in capital-led market disruptions
- PNC Financial Services CEO William Demchak on Tuesday said that the market disruptions caused by the Basel III endgame proposal is an opportunity for the bank to grow.
- 12/05/2023
|
The PNC Financial Services Group, Inc (PNC) Outperforms Broader Market: What You Need to Know
- The PNC Financial Services Group, Inc (PNC) closed at $133.96 in the latest trading session, marking a +1.19% move from the prior day.
- 11/30/2023
|
The PNC Financial Services Group, Inc (PNC) Laps the Stock Market: Here's Why
- In the latest trading session, The PNC Financial Services Group, Inc (PNC) closed at $128.70, marking a +0.59% move from the previous day.
- 11/24/2023
|
The 3 Best Bank Stocks to Survive Higher Yields
- The banking crisis in March 2023 affected even the best bank stocks as higher interest rates put pressure on liquidity. With interest rates at 5% compared with March's 4.75%, risks remain due to tighter lending standards and potentially higher yields.
- 11/16/2023
|
15 A-Rated 6% Yielding SWANs Perfect For What's Coming Next
- Americans are increasingly worried about job losses, and long-term inflation expectations are at a 12-year high. Leading economic indicators suggest a potential recession within three months, while unemployment is predicted to rise, and stagflation is a concern. A-rated ultra-yielding SWANs are a great way to invest money wisely during a high uncertainty period. Rock-solid balance sheets, great risk management, and safe ultra-yield is always in fashion.
- 11/15/2023
|
Q3 List Of Banks And Their Increasing Paper Losses In Their Debt Securities Portfolios
- Many banks have reported significantly larger unrealized securities losses in 3Q as interest rates rose in the quarter. The unrealized losses have grown so large as to be orange flags for a few banks. One of the reasons there could be new increased capital requirements is because of the large unrealized losses across the banking industry.
- 11/11/2023
|
How To Build A Dividend Portfolio With $50,000 Among 20 Dividend Paying Companies/ETFs
- The construction of a dividend-income portfolio brings several benefits for investors, one of which is generating extra income. In today's article, I will show you how you could allocate the amount of $50,000 among 20 dividend paying companies/ETFs that I consider to be attractive right now. Due to its allocation, the portfolio reaches a Weighted Average Dividend Yield [TTM] of 3.86%, indicating that its dividend payments could help you cover your monthly expenses.
- 10/28/2023
|
Regional Lenders Are Getting Smaller to Stay Afloat
- America's regional banks are reportedly hoping to get healthier by getting smaller. As The Wall Street Journal (WSJ) reported Monday (Oct. 23), these lenders are scaling back following a quarter that saw banks like KeyCorp, Truist and Citizens Financial record double-digit declines in profit.
- 10/23/2023
|
PNC Financial (PNC) Q3 Earnings Surpass on Lower Expenses
- Shares of PNC Financial (PNC) gain 1.5% on better-than-expected Q3 earnings, banking on decent expense-control efforts.
- 10/16/2023
|
PNC Financial Group Begins Reducing Workforce by 4%
- PNC Financial Group began staff reductions that will decrease its workforce by 4%. The move is expected to reduce the company's 2024 expenses by $325 million at a time when it is focused on expense management, “particularly in the current environment,” PNC Financial Group Chairman, President and CEO Bill Demchak said Friday (Oct.
- 10/13/2023
|
The PNC Financial Services Group, Inc. (PNC) Q3 2023 Earnings Call Transcript
- The PNC Financial Services Group, Inc. (NYSE:PNC ) Q3 2023 Earnings Conference Call October 13, 2023 11:00 AM ET Company Participants Bryan Gill - Director of Investor Relations Bill Demchak - Chairman, President and Chief Executive Officer Rob Reilly - Executive Vice President and Chief Financial Officer Conference Call Participants John Pancari - Evercore Nate Stein - Deutsche Bank Scott Siefers - Piper Sandler Gerard Cassidy - RBC Bill Carcache - Wolfe Research Peter Troisi - Barclays Mike Mayo - Wells Fargo Securities Ken Usdin - Jefferies Bryan Gill Good morning, and welcome to today's conference call for The PNC Financial Services Group. I am Bryan Gill, the Director of Investor Relations for PNC.
- 10/13/2023
|
PNC Bank stocks drop amid weak loan demand, rising costs
- "PNC Bank (PNC) shares are down approximately 2.7% following lower third-quarter earnings, with weak results in trading revenue, loan syndication, and merger and acquisition revenue. PNC attributes the impact of higher rates on business investments and consumer spending, affecting their bottom line through mid-2024.
- 10/13/2023
|
PNC Financial (PNC) Q3 Earnings Beat Estimates, Stock Down
- Lower provisions and a fall in expenses support PNC Financial's (PNC) Q3 earnings. However, a decrease in NII and fee income are headwinds.
- 10/13/2023
|
The PNC Financial Services Group, Inc (PNC) Reports Q3 Earnings: What Key Metrics Have to Say
- Although the revenue and EPS for The PNC Financial Services Group, Inc (PNC) give a sense of how its business performed in the quarter ended September 2023, it might be worth considering how some key metrics compare with Wall Street estimates and the year-ago numbers.
- 10/13/2023
|
PNC Financial Services posts 3Q revenue miss and drop in earnings
- PNC Financial Services (NYSE:PNC) shares fell more than 3% in early trade after the Pennsylvania-based bank and financial services firm reported a revenue miss and drop in earnings for the third quarter. Revenue declined year-over-year from $5.5 billion to $5.2 billion.
- 10/13/2023
|
The PNC Financial Services Group, Inc (PNC) Q3 Earnings Top Estimates
- The PNC Financial Services Group, Inc (PNC) came out with quarterly earnings of $3.60 per share, beating the Zacks Consensus Estimate of $3.18 per share. This compares to earnings of $3.78 per share a year ago.
- 10/13/2023
|
PNC Financial Services to cut jobs after quarterly profit drop
- PNC Financial Services Group said on Friday it would reduce its workforce by about 4% as part of its cost reduction plans after it posted a drop in profit in the third quarter.
- 10/13/2023
|
RBC's Gerard Cassidy previews bank stocks ahead of earnings
- Gerard Cassidy, RBC Head of U.S. Bank Equity Strategy, joins 'Closing Bell: Overtime' to preview bank earnings.
- 10/12/2023
|
JP Morgan, Wells Fargo, PNC Financial Q3 earnings: Here's what to expect
- Chris Grisanti, Mai Capital Management chief equity strategist, joins 'The Exchange' to discuss financials kicking off Q3 earnings tomorrow, the state of super-regional banks, and more.
- 10/12/2023
|
Is a Surprise Coming for PNC Financial (PNC) This Earnings Season?
- PNC Financial (PNC) is seeing favorable earnings estimate revision activity and has a positive Zacks Earnings ESP heading into earnings season.
- 10/12/2023
|
PNC reportedly cutting jobs but company remains mum on the number of people affected
- PNC Financial Services Group Inc. PNC, +1.19% is reducing its staffing levels but it has yet to provide a specific number of people to be affected by the action, according to reports. The Pittsburgh-based lender with about 60,000 employees said in a statement reported by at least two news outlets that it's reviewing its organizational structure including a shift away from work not fully aligned to its strategic priorities.
- 10/11/2023
|
Key Factors to Affect PNC Financial (PNC) in Q3 Earnings
- PNC Financials (PNC) Q3 earnings are likely to be affected by moderate loan growth and higher costs. Yet, higher residential and commercial mortgage revenues are likely to have buoyed fee income.
- 10/10/2023
|
PNC Financial: One Of The Best Regional Banks Money Can Buy
- Regional banks are generally not good long-term wealth compounders due to their volatile nature and dependence on lending business. The PNC Financial Services Group, Inc. is an exception, with consistently high returns and income. It has lost value recently, making it an attractive investment. The PNC Financial is a super-regional bank with a strong balance sheet, diverse income sources, and strategic acquisitions, making it a standout among its peers.
- 10/09/2023
|
Stock market and earnings outlook: What to watch from financials
- Earnings season kicks off Friday, October 13 as several banks including JPMorgan Chase & Co. (JPM), Citigroup (C), and PNC Financial Services Group (PNC), will be reporting earnings. Scott Krisiloff, The Transcript Editor and Avondale Asset Management Founder, joins Yahoo Finance Live to discuss what to watch for from the financial sector going into earnings season.
- 10/09/2023
|
2 Sectors to Watch Before Halloween
- Subscribers to Chart of the Week received this commentary on Sunday, October 1.
- 10/06/2023
|
Why The PNC Financial Services Group, Inc (PNC) is Poised to Beat Earnings Estimates Again
- The PNC Financial Services Group, Inc (PNC) has an impressive earnings surprise history and currently possesses the right combination of the two key ingredients for a likely beat in its next quarterly report.
- 10/05/2023
|
PNC Financial (PNC) Buys $16.6B Loans of Signature Bridge Bank
- PNC Financial (PNC) acquires failed Signature Bank's $16.6 billion of credit lines to private equity firms. This will complement the company's fund banking business.
- 10/04/2023
|
October's Top 10 High Yield Stocks To Boost Your Dividend Income
- When aiming to reach a diversified investment portfolio with a reduced risk level, I suggest reaching a balanced mix between high dividend yield and dividend growth companies. High dividend yield companies can be an attractive extra source of income, which you can use to cover your monthly expenses. In today's article, I have selected 10 high dividend yield companies that I believe are attractive right now due to a variety of reasons.
- 10/03/2023
|
PNC Acquires $16.6 Billion Of SVB Bridge Bank Loans from FDIC
- PNC Bank (PNC) on Tuesday took on $16.6 billion in capital commitments, mostly loans held by Signature Bridge Bank, from the Federal Deposit Insurance Corp. (FDIC). The bridge bank was set up by federal regulators in March after the collapse of its namesake bank.
- 10/03/2023
|
PNC earnings to be boosted buying capital commitment portfolio from ex-Signature Bank
- PNC Financial Services Group Inc. PNC, -2.24% said Tuesday it's purchasing a $16.6 billion portfolio of Signature Bridge Bank NA commitment facilities from the Federal Insurance Deposit Corp. for an undisclosed sum. The deal is expected to add to PNC's earnings including a boost of 10 cents a share in its fourth quarter results, the bank said.
- 10/03/2023
|
7 Stocks That Should Be on Every Investor's Radar This Fall
- As we head into Fall, it's a good time for investors to rebuild their watch list for the coming months. Despite the recent volatility, quality companies are still trading at reasonable prices, and many such companies have solid fundamentals.
- 09/25/2023
|
Here's Why You Should Hold PNC Financial (PNC) at Present
- PNC Financial's (PNC) solid balance sheet position allows it to grow through acquisitions. Persistently rising costs due to investment in technology might limit bottom-line growth in the near term.
- 09/22/2023
|
Energy is improving, but there are better opportunities in other sectors, says Matrix's David Katz
- David Katz, Matrix Asset Advisors CIO, joins 'The Exchange' to discuss investing in strong fundamentals with reasonable multiples, the 12-month time horizon bull case for PayPal, and more.
- 09/14/2023
|
PNC Financial: Upgrade To Strong Buy, Near 5% Dividend Yield
- PNC Financial stock gets upgraded to Strong Buy, from my buy rating in June. This is more bullish than the consensus from analysts & the quant system. Positives: near 5% dividend yield, earnings YoY growth, valuation vs. sector, current share price, company financial strength. Risk of exposure to office loans is less than 3% of overall loan book.
- 09/14/2023
|
The PNC Financial Services Group, Inc (PNC) Surges 5.8%: Is This an Indication of Further Gains?
- The PNC Financial Services Group, Inc (PNC) saw its shares surge in the last session with trading volume being higher than average. The latest trend in earnings estimate revisions may not translate into further price increase in the near term.
- 09/13/2023
|
7 Stocks to Sell Based on Unusual Options Activity
- While no participating entity in the capital markets is infallible, retail investors may nevertheless find comfort in targeting opportunities – or exiting from them as is the case here – based on unusual options activity. For this edition, we'll be exploring stocks to sell based on the rumblings printed by the so-called smart money.
- 09/12/2023
|
3 Bank Stocks to Buy Yielding 5% or More
- It's not been an easy year for bank stocks. The Invesco KBW Bank ETF (NASDAQ: KBWB ) tracks the performance of the KBW Nasdaq Bank Index, a collection of large national US money centers, regional banks and thrift institutions.
- 09/12/2023
|
Why these investors love bank stocks
- Banks currently are the industry group that is most popular with the top-performing newsletters that my auditing firm monitors.
- 09/11/2023
|
Regional banks may saddle themselves with $63B in fresh debt to meet regulatory requirements: report
- Eighteen regional banks may add about $63 billion of holding company debt to meet proposed regulatory guidelines for lending institutions of $100 billion to $250 billion of assets, in the latest challenge to the sector, according to a Bloomberg report.
- 09/08/2023
|
The 3 Best Bank Stocks to Buy Now: September 2023
- The banking sector has been in the spotlight this year, as a series of events shook the industry and the markets. In March, a wave of bond selloffs triggered by rising inflation expectations caused massive losses for banks holding long-term debt securities.
- 09/07/2023
|
Why Citigroup, PNC Financial, and M&T Bank Stocks Fell in August
- Moody's downgraded 10 regional banks in August, including M&T Bank. The credit ratings firm cited several factors that could result in profitability pressures.
- 09/05/2023
|
Seeking Value With PNC Financial Services Group
- The PNC Financial Services Group, Inc. has been unfairly scrutinized following the March 2023 banking crisis. Rising interest rates and poor capital markets have hurt confidence in PNC Financial. Current yield: 5.15%.
- 09/01/2023
|
The PNC Financial Services Group Announces Third Quarter Earnings Conference Call Details
- PITTSBURGH , Sept. 1, 2023 /PRNewswire/ -- The PNC Financial Services Group, Inc. (NYSE: PNC) expects to issue financial results for the third quarter at approximately 6:30 a.m.
- 09/01/2023
|
Here's how much regional banks could lose under new liquidity rules
- The U.S. Federal Reserve has warned regional banks about stricter liquidity requirements in a fresh regulatory push that will impact 2024 earnings of six affected banks, an analyst at J.P. Morgan said in a research note on Thursday.
- 08/31/2023
|
U.S. Regional Banks May Face Tougher Regulatory Provisions
- Proposed stringent rules that aim to further strengthen the banking industry's resilience are likely to put pressure on margins of banks like PNC Financial (PNC), Citizens Financial (CFG), Zions (ZION), Fifth Third Bancorp (FITB) and JPMorgan (JPM).
- 08/31/2023
|
PNC Financial (PNC) to Sell Latin American Accounts to Insigneo
- PNC Financial (PNC) agrees to sell its Latin American consumer brokerage and investment accounts to Insigneo.
- 08/23/2023
|
PNC Financial (PNC) Opens Online Loan Room PNC Asset Exchange
- PNC Financial (PNC) launches PNC Asset Exchange, an online loan resource and marketplace, expanding its capital market capabilities. The platform is powered by Community Capital.
- 08/17/2023
|
6 Beaten-Up Regional Bank Stocks Ready For A Rebound
- After Moody's cut credit ratings, regional banks are feeling the heat again. However, some smart analysts think there are select bargains in the trash bin.
- 08/12/2023
|
Regional bank shares under fire again after credit downgrade, head for worst day in three months
- The SPDR S&P Regional Banking ETF (KRE) fell by more than 3% and was on track for its worst day since May 4.
- 08/08/2023
|
3 Bank Stocks You'll Regret Not Buying Soon
- Banking stocks face risky macroeconomic conditions. The United States recently upped its plans to borrow more money, a move that resulted in soaring treasury yields.
- 08/07/2023
|
3 Banks Worth a Spot on Your Buy List Following Q2 Earnings
- As Q2 earnings reports roll in, it becomes clear that certain banks stand out as beacons of performance, capturing investors' attention. The article explores three leading banks' impressive financial performance, strategic investments and forward-looking approaches.
- 07/25/2023
|
15 value-stock picks for momentum investors from a money manager who has outperformed the S&P 500 for 30 years
- During the first five months of 2023, there were investors who had difficulty believing in a sustained stock-market rally because the action was dominated by the largest technology companies. But the breadth of participation in the rally has expanded since then.
- 07/25/2023
|
Regional bank stocks: Key technical areas to watch
- Freedom Capital Markets Chief Global Strategist Jay Wood spoke to Yahoo Finance's Jared Blikre about areas to watch with regional ban stocks.
- 07/18/2023
|
PNC Financial (PNC) Stock Down Despite Q2 Earnings Beat
- An increase in NII supported by higher rates aid PNC Financial's (PNC) Q2 earnings. However, increasing expenses and higher provisions are headwinds.
- 07/18/2023
|
The PNC Financial Services Group, Inc (PNC) Q2 Earnings: How Key Metrics Compare to Wall Street Estimates
- Although the revenue and EPS for The PNC Financial Services Group, Inc (PNC) give a sense of how its business performed in the quarter ended June 2023, it might be worth considering how some key metrics compare with Wall Street estimates and the year-ago numbers.
- 07/18/2023
|
PNC beats 2Q earnings forecast but shares fall on lower interest income outlook
- PNC Financial Services (NYSE:PNC) has reported second-quarter results that beat market expectations but trimmed forecasts for its 2023 net interest income. The Pittsburgh-based bank posted a 3.5% rise in revenue to $5.29 billion for the three months to June 30, 2023, supported by a 15% year-over-year increase in net interest income to $3.5 billion.
- 07/18/2023
|
PNC Financial's interest income forecast trim clouds upbeat quarter
- PNC Financial Services Group on Tuesday cut its forecast for full-year net interest income (NII), casting a shadow over the lender's second-quarter earnings beat.
- 07/18/2023
|
PNC's stock slides 3% premarket after revenue falls short of estimates
- PNC Financial Services Group Inc.'s stock PNC, +1.09% slid 3% in premarket trade Tuesday, after the regional bank's second-quarter revenue fell short of estimates. Pittsburgh-based PNC posted net income of $1.500 billion, or $3.36 a share, compared with $1.496 billion, or $3.39 a share, in the year-earlier period.
- 07/18/2023
|
Q2 2023 Earnings Season Gathers Pace
- Q2 2023 Earnings Season Gathers Pace.
- 07/17/2023
|
5+% Yielding No-Brainer Blue-Chips That Could Triple
- The stock market will likely fall 25-30% due to an almost certain recession next year. But there are ways to profit from this recession and the coming zombie bank apocalypse. Strong banks, such as PNC and Truist, are the most likely to buy out failed banks for pennies on the dollar, potentially boosting their earnings as much as 45% overnight.
- 07/15/2023
|
PNC Financial: Buy This 5% Yielding Blue-Chip Bargain Before Everyone Else Does
- There are many reasons to be worried about the stock market, including recession, inflation, and crazy valuations. But it's always a market of stocks, not a stock market, and wonderful blue-chip bargains always are available. PNC is in a 45% bear market that's 100% not justified by its fundamentals. Analysts, rating agencies, bond investors, and valuations all agree, PNC is a strong buy.
- 07/13/2023
|
4 Stocks to Watch on Dividend Hikes Amid Market Uncertainty
- Investors may keep a tab on stocks like LNN, OZK, PNC and WOR, which have lately hiked their dividend payments.
- 07/12/2023
|
PNC Financial (PNC) to Post Q2 Earnings: What's in Store?
- PNC Financial's (PNC) Q2 earnings are likely to have been affected by declining NII and non-interest income. Also, higher expenses and reserves are expected to have impacted bottom-line growth.
- 07/11/2023
|
Is PNC Financial Services (PNC) a Great Stock for Value Investors?
- Is PNC Financial Services (PNC) a great pick from the value investor's perspective right now? Read on to know more.
- 07/11/2023
|
Solid Balance Sheet Aids PNC Financial (PNC), High Costs Ail
- PNC Financial (PNC) is expanding through acquisitions. Solid loan and deposit balances are positives.
- 07/10/2023
|
One Upcoming Dividend Increase
- The article provides a list of stocks expected to increase their dividends in the coming week, a good sign of business performance and shareholder commitment. The list is compiled by merging data on companies with a history of dividend growth with their future dividend payments, all of which have at least five years of consistent growth. The author uses various metrics and categories to assess and present the data, and advises investors to do their own due diligence before investing.
- 07/06/2023
|
These 20 banks have had the largest cuts to earnings estimates
- Earnings season for the largest U.S. banks will begin on Friday, July 14, when JPMorgan Chase & Co., Citigroup Inc. and Wells Fargo & Co. announce their second-quarter results. Rounding out the “big six” industry group, Bank of America Corp., Goldman Sachs Group Inc. and Morgan Stanley are all scheduled to report on July 18.
- 07/06/2023
|
5 Stocks in Focus on Their Recent Dividend Hike
- At this stage, dividend-paying stocks should be in demand as investors try to safeguard their portfolios. Five such stocks are: GIS, WOR, GBX, PNC, GLOP.
- 07/05/2023
|
PNC Financial (PNC) Ups Dividend, Expects SCB to Dip to 2.5%
- With expectations of a decrease in the SCB for PNC Financial (PNC), the company increases its quarterly dividend by 3.3%. However, it expects to reduce its share repurchase activity.
- 07/04/2023
|
Which Super-Regional Bank Performed the Best in the Fed's Stress Test?
- Stress testing is an exercise conducted by regulators to ensure the safety and soundness of the banking system. But it is also important for investors because it helps determine bank capital requirements.
- 07/01/2023
|
Better valuations are ahead for bank stocks following stress test results: Christopher Marinac
- Christopher Marinac, Janney Montgomery Scott director of research, joins 'Fast Money' to discuss the results of the Federal Reserve's banking stress test and what that means for bank stocks moving forward.
- 06/28/2023
|
Fed Stress Test Results Show All 23 Banks Passed
- The 23 largest US banks passed the Federal Reserve's annual stress test, clearing the way for payouts. Sonali Basak has more on "Bloomberg Markets: The Close.
- 06/28/2023
|
‘Cautious' JPMorgan analyst cuts price targets on nine major banks
- J.P. Morgan analyst Vivek Juneja on Tuesday cut price targets on nine major U.S. banks due to his “cautious” view on the sector in the face of increased regulatory requirements, declining net interest income and higher expenses pressured by inflation. The comment came a day ahead of the Fed's stress tests results on bank capital.
- 06/27/2023
|
HELOCs are back. Cash-strapped borrowers are tapping into a $33 trillion pile of home equity.
- Home-equity lines of credit (HELOCs) and second-lien mortgages have been staging a notable comeback as U.S. homeowners look for liquidity and ways to monetize the pandemic surge in home prices, according to BofA Global.
- 06/26/2023
|
PNC Financial: Now A Value Stock With A 4.9% Yield
- PNC Financial's shares are down 22% year-to-date, but there is potential for an up to 27% recovery gain if PNC returns to its pre-crisis valuation. The bank's deposit base is growing despite a challenging interest rate environment, and it currently offers a near-5% dividend yield. PNC Financial also has very little exposure to office real estate as well as a stable dividend payout ratio.
- 06/23/2023
|
PNC Financial Near 5% Dividend Yield, A Buying Opportunity
- PNC Financial has a Buy Rating due to a favorable interest rate environment, strong capital levels, and minimal office real estate exposure. Its dividend yield is near 5%, competitive within the bank sector. A potential risk for PNC is its exposure to uninsured deposits, with 80% of commercial deposits being uninsured.
- 06/15/2023
|
PNC Financial: An Attractive Looking Compounder
- PNC Financial Services continues to grow revenues and free cash flow while reducing share count, which is a potent engine for shareholder value creation. CRE exposure issues, banking regulation concerns, and macroeconomic fears are overblown. PNC stock is priced attractively. PNC could be a big winner coming out of the regional banking crisis.
- 06/14/2023
|
My Top 10 High Yield Dividend Stocks For June 2023
- I present my top 10 High Yield dividend stocks that are poised to offer strong future returns. The top 10 stocks on the watchlist offer a collective 5.08% dividend yield and have grown their dividends at a historical rate of 35.55% per year over the last five years. New stocks on the watchlist include Best Buy, Goldman Sachs, and Paychex, all of which appear undervalued based on dividend yield theory and have strong dividend growth histories.
- 06/03/2023
|
High Yield Stock Watchlist: June 2023
- There are 20 stocks on my high yield watchlist for June 2023. The majority of the stocks on my watchlist are undervalued based on dividend yield theory. An equally weighted portfolio of these stocks underperformed the Vanguard High Yield Dividend ETF by about 1.5% during the month of May.
- 06/02/2023
|
Zelle and Chase working to resolve issue with accidental double payments
- A spokesperson for JPMorgan Chase & Co. JPM, +2.40% on Friday has confirmed statements on social media that some customers that use Zelle are seeing duplicate transactions and fees on their checking accounts. “We're sorry,” the spokesperson said in an email to MarketWatch.
- 06/02/2023
|
U.S. banks mull office-space loan exposure at Citi event and prepare for a slow boil
- Big U.S. banks face a challenging environment for office-space loans but the situation is expected to remain manageable for lenders over time, Citi analyst Keith Horowitz said Monday in a summary of a recent industry event hosted by the bank.
- 05/30/2023
|
Digital Wallets: The Winners Are Obvious
- We discuss the dominant digital wallets. We highlight P2P platforms and how they'll morph.
- 05/19/2023
|
5 High Yield Stocks With Steady Dividend Growth And An Attractive Valuation
- I consider companies that combine a relatively high Dividend Yield and Dividend Growth Rate to be particularly attractive for dividend income investors. The reason being that these companies can help you to significantly increase your extra income in the form of dividends from year to year.
- 05/18/2023
|
7 Bank Stocks That Desperately Need Warren Buffett's Help
- As the banking crisis persists, bank stocks continue to trade at depressed prices. With this, many investors are waiting for Warren Buffett to step in and save the day.
- 05/18/2023
|
Loan Growth Aids PNC Financial (PNC) Despite Higher Costs
- PNC Financial (PNC) is expanding through acquisitions. Solid loan and deposit balances are positives.
- 05/16/2023
|
Should You Consider PNC Financial (PNC) for Attractive Dividend?
- Strength in core banking franchise and impressive fundamentals make a case for PNC Financial (PNC) as a dividend pick for income investors amid the recession fears.
- 05/15/2023
|
2 Regional Bank Stocks For Your May 2023 Watchlist
- Regional banking stocks to watch in the stock market this week.
- 05/09/2023
|
Bank Stocks Fall Farther. 'Equity Manipulation' Threat Rises.
- Bank stocks fall early Tuesday after financial shares pared gains Monday. Investors digest latest data.
- 05/09/2023
|
Why PNC Financial Stock Dropped 10.9% This Week
- Bank stocks struggled this week, as there was another bank collapse. The Federal Reserve raised interest rates for the 10th straight time.
- 05/05/2023
|
Jim Cramer: The FDIC doesn't seem to have a plan for other regional banks
- CNBC's Jim Cramer and David Faber discuss the news of the day.
- 05/03/2023
|
S&P 500: Nvidia Stock Is A Top Performer, While Regional Banks Skid
- On Semiconductor and Nvidia were among S&P 500 winners Monday, while regional bank stocks were among the worst performers. The post S&P 500: Nvidia Stock Is A Top Performer, While Regional Banks Skid appeared first on Investor's Business Daily.
- 05/01/2023
|
The Fed's next move: Pause, pivot or hike?
- CNBC's Leslie Picker, Steve Liesman, and Mike Santoli along with The Wall Street Journal's Gunjan Banerji joins 'Power Lunch' to discuss the Fed's upcoming rate decision, First Republic's sale to JPMorgan, and ongoing bank sector woes.
- 05/01/2023
|
Bill Smead on SVB fallout: Free money created a lot of ignorant investments
- Bill Smead, Smead Capital Management chief investment officer, joins 'The Exchange' to discuss the banking crisis and fallout and how investors should position.
- 05/01/2023
|
Citizens, PNC, UMB Stock Plummet After First Republic's Epic Failure—Here Are The Bank Stocks That Are Plunging
- JPMorgan Chase's stocks have soared following its assumption of First Republic Bank deposits.
- 05/01/2023
|
My Top 10 High Yield Dividend Stocks For May 2023
- I present my top 10 High Yield dividend stocks that are poised to offer strong future returns. The annualized rate of return for this watchlist is 14.50% over the past 30 months.
- 05/01/2023
|
PNC, JPM putting in final bids for First Republic in FDIC auction -sources
- PNC Financial Services Group and JPMorgan Chase & Co were among banks set to submit final bids for First Republic Bank by midday Sunday in an auction being run by U.S. regulators, sources familiar with the matter.
- 04/30/2023
|
JPMorgan, PNC Bid to Buy First Republic as Part of FDIC Takeover
- Big banks including JPMorgan Chase & Co. and PNC Financial Services Group Inc. are vying to buy First Republic Bank in a deal that would follow a government seizure of the troubled lender.
- 04/28/2023
|
3 High-Yield Bank Stocks to Buy
- Every now and then, the stock market overreacts. Investors sell stocks because of fear, and solid businesses are mispriced.
- 04/28/2023
|
PNC Financial Services: A More Conservative Risk-Reward Play
- PNC Financial Services is dealing with headwinds in the banking industry, such as higher funding costs. However, the bank has a good deposit profile and a strong capital position.
- 04/27/2023
|
U.S. banking: Smaller companies ‘more likely to go to regional banks,' professor says
- University of Maryland Finance Professor David Kass joins Yahoo Finance Live to discuss the Fed's 2019 decision to loosen rules for midsize banks, bank regulation, and the outlook for regional banks.
- 04/24/2023
|
2023 Q1 Earnings Season Off to a Promising Start
- The 2023 Q1 earnings picture emerging at this early stage is one of resilience and stability, with an above-average proportion of companies beating estimates and providing a good-enough outlook in an uncertain macro environment.
- 04/19/2023
|
2023 Q1 Earnings Season Off to a Promising Start
- The 2023 Q1 earnings picture emerging at this early stage is one of resilience and stability, with an above-average proportion of companies beating estimates and providing a good-enough outlook in an uncertain macro environment.
- 04/19/2023
|
7 Stocks That Could Skyrocket in the Next 12 Months
- There are multiple signs that inflation is rolling over, while consumer spending remains strong and corporate earnings are beating expectations. Meanwhile, the so-called credit crunch many investors have feared really isn't materializing.
- 04/19/2023
|
PNC CEO: What happened with the banks that failed has nothing to do with their sizes
- PNC CEO Bill Demchak joins 'Squawk on the Street' to discuss the company's earnings report, banking turbulence, and more.
- 04/19/2023
|
Bank earnings ‘off to a good start,' with Bank of America and Goldman Sachs on deck
- First-quarter earnings from the largest U.S. banks are off to a mostly positive beginning despite a tough start to the year for the sector, analysts at Jefferies said Monday.
- 04/17/2023
|
Apple Among 14 Companies To Announce Dividend Growth In Late April
- Procter & Gamble extended its dividend growth streak to 67 years in the first two weeks of April with a 3% increase. Most of the increases I expected in the first half of April will actually occur in the upcoming week.
- 04/16/2023
|
PNC Financial (PNC) Q1 Earnings Beat Estimates on Higher NII
- An increase in NII supported by higher rates, aid PNC Financial's (PNC) Q1 earnings. However, increasing expenses and higher provisions are headwinds.
- 04/14/2023
|
PNC seems 'expensive' heading into the print, says KBW's David Konrad
- CNBC's Hugh Son and Dom Chu with David Konrad, KBW large cap bank analyst, joins 'The Exchange' to discuss banks.
- 04/14/2023
|
PNC Financial Services Group, Inc. (PNC) Q1 2023 Earnings Call Transcript
- PNC Financial Services Group, Inc. (PNC) Q1 2023 Earnings Call Transcript
- 04/14/2023
|
Big bank earnings: Breaking down earnings for JPMorgan, Citi, PNC, and Wells Fargo
- Yahoo Finance Live's Rachelle Akuffo breaks down big bank earnings and recaps JPMorgan CEO Jamie Dimon and CFO Jeremy Barnum's commentary on Friday morning's earnings call.
- 04/14/2023
|
Major Banks Kick Earnings Season Off With Beats
- Major Banks Kick Earnings Season Off With Beats.
- 04/14/2023
|
PNC, BlackRock stocks rise on Q1 earnings beats
- Yahoo Finance Live anchors Brad Smith and Brian Sozzi break down the rise in stock for PNC and BlackRock following the release of their earnings.
- 04/14/2023
|
PNC Financial Services 1Q earnings beat profit and revenue estimates
- PNC Financial Services (NYSE:PNC) Group Inc shares climbed after the closely watched US regional bank reported first-quarter earnings which beat Wall Street estimates on revenue which jumped 59.9% on a year-over-year basis helped by higher deposits and interest rates. For the period ended March 31, 2023, the Pittsburg-based bank reported earnings of 1.7 billion, or $3.98 per diluted share on revenue of $7.7 billion.
- 04/14/2023
|
The PNC Financial Services Group, Inc (PNC) Beats Q1 Earnings and Revenue Estimates
- The PNC Financial Services Group, Inc (PNC) came out with quarterly earnings of $3.98 per share, beating the Zacks Consensus Estimate of $3.60 per share. This compares to earnings of $3.29 per share a year ago.
- 04/14/2023
|
Banks still face question over selling or holding debt, says Chris Whalen
- Chris Whalen, Whalen Global Advisors chairman, joins 'Squawk Box' to discuss Whalen's thoughts on the regional banks, how yield action may be helping the banks and more.
- 04/14/2023
|
PNC Financial stock pops after EPS beats expectations while revenue misses
- CNBC's Melissa Lee delivers PNC Financial's quarterly earnings results.
- 04/14/2023
|
10 Banks Are Raking It In As Their Profits Soar, Analysts Say
- What banking crisis? For some banks, profits are booming.
- 04/14/2023
|
PNC Financial beats profit estimates on boost from higher interest rates
- PNC Financial Services Group reported an 18.5% rise in first-quarter profit on Friday, as the Federal Reserve's rate hikes fueled a surge in the U.S. regional lender's net interest income (NII).
- 04/14/2023
|
PNC Stock Jumps. The Regional Bank Beat on Earnings.
- The "super regional" lender smashed expectations for earnings per share in the first three months of 2023.
- 04/14/2023
|
Markets Rally on Cooler Economic Data; More Results on Deck
- Weaker economic prints are beginning to reveal an alternative narrative: perhaps the Fed has done enough already.
- 04/13/2023
|
Stock Market Rallies On Cooling Inflation; Big Bank Earnings For JPMorgan, Citigroup Up Next
- The stock market rallied on cooling inflation, while big bank earnings from JPMorgan and Citigroup are due out Friday morning. The post Stock Market Rallies On Cooling Inflation; Big Bank Earnings For JPMorgan, Citigroup Up Next appeared first on Investor's Business Daily.
- 04/13/2023
|
Should You Buy PNC Financial (PNC) Ahead of Earnings?
- PNC Financial (PNC) is seeing favorable earnings estimate revision activity and has a positive Zacks Earnings ESP heading into earnings season.
- 04/11/2023
|
Banks Are On Sale But Risks Remain
- One month ago, Silicon Valley Bank failed, with a resulting decline across the diversified banking industry. Some investors may be tempted to buy the dip, while others are considering doubling down on losing positions.
- 04/11/2023
|
JPMorgan Leads Bank Earnings This Week As Balance Sheets, Guidance Key
- JPMorgan reports Friday, along with Wells Fargo, Citigroup and PNC Financial. Balance sheets and guidance may trump Q1 earnings.
- 04/10/2023
|
PNC Financial (PNC) to Post Q1 Earnings: What's in Store?
- PNC Financial's (PNC) Q1 earnings are likely to be affected by declining NII and non-interest income. Decent loan growth along with declining expenses act as near-term tailwinds.
- 04/10/2023
|
Goldman Sachs warns of ‘the worst earnings season in years'
- Yahoo Finance Live anchors Julie Hyman and Brad Smith discuss Goldman Sachs's earnings season expectations.
- 04/10/2023
|
U.S. Bank Deposits Fall For 10th Straight Week As Worries Continue
- U.S. bank deposits fell for the 10th week in a row, the Fed reported Friday, Smaller financials reported a small gain. Several banks report earnings next week.
- 04/07/2023
|
The PNC Financial Services Group, Inc (PNC) Earnings Expected to Grow: Should You Buy?
- The PNC Financial Services Group, Inc (PNC) possesses the right combination of the two key ingredients for a likely earnings beat in its upcoming report. Get prepared with the key expectations.
- 04/07/2023
|
KBW upgrades Fifth Third Bancorp to outperform and cuts PNC Financial to underperform in bank ratings shuffle
- KBW shuffled ratings on five banks ahead of first-quarter earnings reports from financial companies that begin on Friday, April 14. PNC Financial Services Group Inc. stock PNC, -1.14% fell 0.9% in premarket trades after KBW downgraded the stock to underperform from market perform and cut its price target to $125 a share from $157 a share.
- 04/06/2023
|
Economic Data, Bank Earnings Slated for Next Week
- There is plenty of economic data scheduled for the second week of April.
- 04/05/2023
|
High Yield Stock Watchlist: April 2023
- There are 19 stocks on my high-yield watchlist for April 2023. The majority of the stocks on my watchlist are undervalued based on dividend yield theory.
- 04/03/2023
|
My Top 10 High Yield Dividend Stocks For April 2023
- I present my top 10 High Yield dividend stocks that are poised to offer strong future returns. The annualized rate of return for this watchlist is 14.14% over the past 29 months.
- 04/03/2023
|
3 Regional Bank Stocks to Buy Despite the Banking Crisis
- On my StockTwits account on March 27, I wrote, “My view is that the “banking crisis” was a relatively minor situation involving a few troubled banks that the Fed and other central banks could handle relatively easily.
- 04/03/2023
|
Johnson & Johnson, Procter & Gamble Among 11 Companies To Continue Dividend Growth In Early April
- Eleven companies announced annual dividend increases in March. Colgate-Palmolive started its 7th decade of dividend growth in March with a 2% boost. Steel Dynamics followed up last year's 31% boost with a 25% increase, resulting in a 63% payout increase since 2022.
- 04/01/2023
|
First Republic and Other Bank Stocks Rise as Yellen Argues For Tighter Regulations
- Treasury Secretary Janet Yellen at a conference on Thursday will say that deregulation may have gone too far and that it's time to repair the cracks in the regulatory perimeter.
- 03/30/2023
|
PNC Financial: The Regional Leader In The Banking Crisis
- In March, PNC Financial outperformed its peers in the iShares Regional Banks ETF, demonstrating the market's confidence in its leadership prowess. Even though the bank remains resilient, a potentially worse economic downturn or a further spread of the banking crisis could still affect its stability.
- 03/27/2023
|
Banking News and Stocks to Watch
- Are Monday.com and Xponential Fitness on your radar?
- 03/25/2023
|
These Bank Stocks Hit Lows—Some Even All-Time Lows—This Month
- National giants like Bank of America and Wells Fargo sank to their lowest share price in over two years Friday.
- 03/24/2023
|
These Seven Big Banks Are Deep Into Bear Market Territory. Should Investors Try To Catch A Falling Knife?
- Bank of America, Citigroup, JPMorgan Chase, and Wells Fargo are the four big banks considered ‘too-big-to-fail'.
- 03/24/2023
|
PNC Financial Services Group: A Bank Facing Real Earnings Concerns, Like Many
- After taking a big ride on its BlackRock stake, The PNC Financial Services Group, Inc. swapped its investments for BBVA USA in 2020. This meant that the bank doubled down exposure on banking, something which hurt the business now.
- 03/24/2023
|
4 Bank Stocks STILL Paying Secure Dividends
- You may think dividend-paying bank stocks are in trouble, or at least their dividends are given the current climate. The banking crisis that began with the collapse of Silicon Valley Bank continues, leaving what look like bargains but could be yield traps.
- 03/24/2023
|
Playbook: Bank Stock Could Face Sector Pressure
- Below is an excerpt from this Monday's episode of Schaeffer's Playbook of the Week , featuring Schaeffer's Senior Equity Analyst Joe Hargett.
- 03/21/2023
|
Stocks of 11 banks that pumped $30 billion into First Republic Bank all lower premarket
- The stocks of the 11 banks that contributed $30 billion in uninsured deposits to embattled lender First Republic Bank on Thursday were all lower in premarket trade Friday, amid concerns the unprecedented action had failed to prop up the regional bank's stock. First Republic Bank stock FRC, +9.98% was down 4% premarket, after it said it would suspend its dividend to conserve cash.
- 03/17/2023
|
JPMorgan, BofA, 9 Other Banks Deposit $30 Billion in First Republic
- Eleven large U.S. banks are making uninsured deposits totaling $30 billion into First Republic Bank.
- 03/16/2023
|
Eleven U.S. banks pledge $30 billion for First Republic
- Bank of America BAC , Citigroup C , JPMorgan Chase JPM and Wells Fargo WFC said Thursday they are each making $5 billion uninsured deposits as part of a $30 billion package from 11 banks into First Republic Bank FRC. The move “reflects their confidence in First Republic and in banks of all sizes,” the banks said in a joint statement.
- 03/16/2023
|
Banks' Big Plan Might Solve the Immediate Problem, but Not the Bigger Ones
- A rescue of First Republic by big banks wouldn't put to bed emerging questions about the banking system.
- 03/16/2023
|
First Republic Bank could see $30B in rescue deposits coming, report says
- First Republic Bank was caught in the wake of Silicon Valley Bank's collapse over the weekend and saw its shares plunge earlier this week. Shares were rebounding as this new development emerged.
- 03/16/2023
|
UBS analyst Erika Najarian breaks down regional banks
- Erika Najarian, UBS equity research analyst, joins 'Squawk on the Street' to discuss her thoughts about regional bank stocks as they continue to be punished.
- 03/16/2023
|
The bank environment is not in a state that attracts capital, says Worth Charting 's Carter Worth
- Carter Worth, Worth Charting Founder and CEO, joins' Power Lunch' to discuss bank technicals, historical investment changes, and investors pulling away from bank stocks.
- 03/15/2023
|
Regional banks will be a volatile group for some time, says Piper Sandler's Siefers
- Scott Siefers, managing director and senior research analyst at Piper Sandler, joins 'Squawk Box' to discuss his thoughts about regional banks, how many unrealized losses there are in the industry, and more.
- 03/15/2023
|
PNC stock headed for lowest close in 2 years amid SVB contagion fears
- Yahoo Finance Live anchors Seana Smith and Allie Canal discuss PNC as the financial service company as it's stock heads for it's lowest close in over two years.
- 03/13/2023
|
Regional banks might be more reluctant with lending following the SVB collapse: CFRA's Sam Stovall
- Sam Stovall, CFRA Research chief investment strategist, joins 'Power Lunch' to discuss regional banks suffering following the Silicon Valley Bank collapse, the market response to SVB's crisis, and investor worries about the economic impact of SVB's fallout.
- 03/13/2023
|
Depositor protection still lacks codification, says NYT's Kate Kelly
- Hugh Son, banking reporter for CNBC.com, and Kate Kelly, a reporter with The New York Times, join 'Power Lunch' to discuss the run on regional banks, the difference between Silicon Valley Bank's collapse and the 2008 crisis, and the effort to contain the SVB crisis.
- 03/13/2023
|
SVB, SBNY Fallout: Why Contagion Risk to Other Banks is Remote
- Considerable strength in the U.S. banking system and steps taken by agencies will prevent more bank runs like SVB Financial Group and Signature Bank (SBNY).
- 03/13/2023
|
Why The PNC Financial Services Group, Inc (PNC) is a Top Dividend Stock for Your Portfolio
- Dividends are one of the best benefits to being a shareholder, but finding a great dividend stock is no easy task. Does The PNC Financial Services Group, Inc (PNC) have what it takes?
- 03/10/2023
|
High Yield Stock Watchlist: March 2023
- There are 17 stocks on my high-yield watchlist for March 2023. The majority of the stocks on my watchlist are undervalued based on dividend yield theory.
- 03/07/2023
|
THE PNC FINANCIAL SERVICES GROUP ANNOUNCES FIRST QUARTER 2023 EARNINGS CONFERENCE CALL AND VIRTUAL-ONLY ANNUAL SHAREHOLDERS MEETING DETAILS
- PITTSBURGH , March 7, 2023 /PRNewswire/ -- The PNC Financial Services Group, Inc. (NYSE: PNC) expects to issue financial results for the first quarter of 2023, Friday, April 14, as previously announced, at approximately 6:45 a.m. (ET). PNC Chairman, President and Chief Executive Officer William S.
- 03/07/2023
|
My Top 10 High Yield Dividend Stocks For March 2023
- I present my top 10 High Yield dividend stocks that are poised to offer strong future returns. The annualized rate of return for this watchlist is 14.43% over the past 28 months.
- 03/01/2023
|
The PNC Financial Services Group, Inc (PNC) Could Be a Great Choice
- Dividends are one of the best benefits to being a shareholder, but finding a great dividend stock is no easy task. Does The PNC Financial Services Group, Inc (PNC) have what it takes?
- 02/22/2023
|
The PNC Financial Services Group, Inc (PNC) Up 7% Since Last Earnings Report: Can It Continue?
- The PNC Financial Services Group, Inc (PNC) reported earnings 30 days ago. What's next for the stock?
- 02/17/2023
|
Are You Looking for a High-Growth Dividend Stock?
- Dividends are one of the best benefits to being a shareholder, but finding a great dividend stock is no easy task. Does The PNC Financial Services Group, Inc (PNC) have what it takes?
- 02/06/2023
|
Solid Performance and a Solid Dividend Have Braced PNC for a Recession
- PNC is the sixth-largest bank by assets in the U.S.
- 02/05/2023
|
How Zelle is different from Venmo, PayPal and CashApp
|
PNC CEO Bill Demchak on recession risks, jobs report and the state of the consumer
- Bill Demchak, PNC CEO, joins 'Closing Bell' to discuss the jobs report, the likelihood of a recession and the state of the economy.
- 02/03/2023
|
Barron's And Bloomberg 2023 Ideal Dividend Stocks Of The Year
- Two Barron's Annual Roundtable, plus one Bloomberg Intelligence articles published late-January listed 99 intriguing stocks for 2023; 77 were unduplicated US publicly-listed companies, of which, 56 paid-dividends. Barron's two roundtable discussions January 20 and 27 split 49 picks from 9 panelists in half, whereas Bloomberg detailed all 50 in their January 16 BusinessWeek edition.
- 01/31/2023
|
PNC Financial: My, Oh My, This Is Great DGI
- The PNC Financial Services Group, Inc.'s acquisition of BBVA is beginning to bear fruit. However, higher rates are a double-edged sword.
- 01/28/2023
|
What bank-enabled digital wallets mean for Fintech
- Wolfe Research analyst Darrin Peller joins 'Tech Check' to discuss whether big banks are good at consumer fintech.
- 01/23/2023
|
2 Best Stocks to Own for Passive Income in 2023
- An analysis by S&P Global says that these two stocks are prime candidates to significantly raise dividends this year.
- 01/22/2023
|
PNC Is A Classic Case Of Not Enough Good, Not Enough Bad
- PNC's recent string of acquisitions has given PNC much-needed scale and may drive above-average growth for a few years. Current high rates may drive strong near-term success, but any Fed backpedaling will quickly eat away at margin improvements.
- 01/19/2023
|
Why The PNC Financial Services Group, Inc (PNC) is a Great Dividend Stock Right Now
- Dividends are one of the best benefits to being a shareholder, but finding a great dividend stock is no easy task. Does The PNC Financial Services Group, Inc (PNC) have what it takes?
- 01/19/2023
|
Why Did Wall Street Fall Hard Wednesday? These 2 Stocks Have Some Answers
- Investors are seeing volatility again.
- 01/18/2023
|
PNC stock falls after missing on earnings, revenue growth estimates
- Shares of PNC are down after the company missed Street estimates for full-year revenue growth.
- 01/18/2023
|
The PNC Financial Services Group, Inc. (PNC) Q4 2022 Earnings Call Transcript
- The PNC Financial Services Group, Inc. (NYSE:PNC ) Q4 2022 Results Conference Call January 18, 2023 9:00 AM ET Company Participants Bryan Gill - SVP, Director-IR Bill Demchak - Chairman, President & CEO Rob Reilly - EVP, CFO Conference Call Participants John Pancari - Evercore John McDonald - Autonomous Research Gerard Cassidy - RBC Bill Carcache - Wolfe Research Betsy Graseck - Morgan Stanley Ken Usdin - Jefferies Mike Mayo - Wells Fargo Securities Ebrahim Poonawala - Bank of America Matt O'Conor - Deutsche Bank Vivek Juneja - JPMorgan Bryan Gill Good morning. Welcome to today's conference call for the PNC Financial Services Group.
- 01/18/2023
|
SCHW Stock, PNC Stock Slide after Charles Schwab, PNC Financial Miss Earnings
- SCHW stock, PNC stock fell early Wednesday after Charles Schwab, PNC Financial Services missed Q4 earnings estimates. The post SCHW Stock, PNC Stock Slide after Charles Schwab, PNC Financial Miss Earnings appeared first on Investor's Business Daily.
- 01/18/2023
|
The PNC Financial Services Group, Inc (PNC) Q4 Earnings Miss Estimates
- The PNC Financial Services Group, Inc (PNC) delivered earnings and revenue surprises of -11.65% and 1.23%, respectively, for the quarter ended December 2022. Do the numbers hold clues to what lies ahead for the stock?
- 01/18/2023
|
PNC Profit Seen Rising With Rates
- The sixth-largest US bank's loan trends and credit reserves will also be in focus when it reports Q4 results early Wednesday.
- 01/17/2023
|
High Yield Stock Watchlist - January 2023
- There are 15 stocks on my high yield watchlist for January 2023. The majority of the stocks on my watchlist are undervalued based on dividend yield theory.
- 01/13/2023
|
10 Biggest Companies Reporting Earnings in the Third Week of Jan 2023
- The fourth quarter earnings season officially started this week. Wall Street is expecting a rough quarter ahead, with Goldman Sachs and other banks preparing for layoffs.
- 01/11/2023
|
Why The PNC Financial Services Group, Inc (PNC) Could Beat Earnings Estimates Again
- The PNC Financial Services Group, Inc (PNC) has an impressive earnings surprise history and currently possesses the right combination of the two key ingredients for a likely beat in its next quarterly report.
- 01/05/2023
|
Bank The Dividend Yield And Look For Incremental Upside In Regional Banks In 2023
- 2022 represented a challenging year for the regional banks where their price performance didn't offer a respite vs. the bear market hitting the major indices. The current wall of worry hanging over the banks will be resolved in 2023.
- 12/30/2022
|
PNC Financial: Banking On It
- The PNC Financial Services Group has seen a few busy years on the corporate front. Results are a bit mixed, nothing too great, nothing too bad either.
- 12/12/2022
|
3 Stocks With High Dividend Yields
- These three steady, stable companies are built to weather the storm.
- 12/10/2022
|
THE PNC FINANCIAL SERVICES GROUP ANNOUNCES FOURTH QUARTER AND FULL YEAR EARNINGS CONFERENCE CALL DETAILS
- PITTSBURGH , Dec. 7, 2022 /PRNewswire/ -- The PNC Financial Services Group, Inc. (NYSE: PNC) expects to issue financial results for the fourth quarter and full year 2022, at approximately 6:30 a.m. (ET), Wednesday, Jan. 18, 2023, as previously announced.
- 12/07/2022
|
PNC Financial Has A Better Mix Of Drivers In A Sector That's Still Off Its Highs
- Commercial loan demand remains healthy, which should support healthy net interest income growth at PNC, but deposit outflows and costs are an ongoing risk. PNC is built and run to be an "all-weather" bank; if 2023 sees weaker macroeconomic conditions than expected, the bank could outperform, but vice versa if 2023 proves stronger.
- 11/28/2022
|
Regional Bank Round-Up
- Regional banks have been hit hard during the market sell-off this year. The combination of rising inflation, higher interest rates, falling home sales and decreasing financial prices have hit banks' bottom lines.
- 11/07/2022
|
These 7 Seven Financial Companies Are Making Money Hand Over Fist as Interest Rates Surge
- After a decade and a half of ultra-low interest rates, banks are finally making good money on interest income.
- 10/30/2022
|
The PNC Financial Services Group, Inc. (PNC) Q3 2022 Earnings Call Transcript
- The PNC Financial Services Group, Inc. (NYSE:PNC ) Q3 2022 Results Conference Call October 14, 2022 11:00 AM ET Company Participants Bryan Gill - SVP, Director-IR Bill Demchak - Chairman, President & CEO Rob Reilly - EVP, CFO Conference Call Participants John Pancari - Evercore Scott Siefers - Piper Sandler Gerard Cassidy - RBC Ken Usdin - Jefferies Mike Mayo - Wells Fargo Securities Bill Carcache - Wolfe Research Michael Rose - Raymond James Nathan Stein - Deutsche Bank Bryan Gill Well, good morning, and welcome to today's conference call for the PNC Financial Services Group. Participating on this call are PNC's Chairman, President and CEO, Bill Demchak; and Rob Reilly, Executive Vice President and CFO.
- 10/14/2022
|
PNC Financial (PNC) Q3 Earnings & Revenues Beat Estimates
- Higher net interest income and loan growth, along with declining expenses, aid PNC Financials' (PNC) Q3 results. A fall in fee income and deposits were major headwinds for the company.
- 10/14/2022
|
The PNC Financial Services Group, Inc (PNC) Beats Q3 Earnings and Revenue Estimates
- The PNC Financial Services Group, Inc (PNC) delivered earnings and revenue surprises of 3.28% and 3.04%, respectively, for the quarter ended September 2022. Do the numbers hold clues to what lies ahead for the stock?
- 10/14/2022
|
Bank Stock Brushes Off Bear Note Before Earnings
- PNC Financial Services Group Inc (NYSE:PNC) is one of the many bank names that will close out the week with an earnings report.
- 10/13/2022
|
Bank stocks will rip after the macro headwinds are over, says Wells Fargo's Mike Mayo
- Mike Mayo, Wells Fargo Securities, joins 'Closing Bell: Overtime' to discuss bank earnings season.
- 10/12/2022
|
Q3 Earnings Season Starts With The Banks: What Investors Need To Know Before Friday
- The banks are set to kick off what will be a closely-watched third-quarter earnings season when they report financial results this coming Friday.
- 10/12/2022
|
These Are The 10 Biggest Companies Revealing Earnings Next Week
- The third quarter 2022 earnings season reporting officially kicks off next week with many big names in the financial world announcing their earnings, including JPMorgan Chase, Citigroup and more.
- 10/07/2022
|
RBC's Cassidy prefers ‘regionals' over big banks ahead of earnings
- Regional banks are a better pick than their bigger rivals over the next six to twelve months, says Gerard Cassidy. He's a Senior Analyst at RBC Capital Markets.
- 10/05/2022
|
PNC Financial Services Has Become Deeply Undervalued
- PNC is offering a nearly 10-year high dividend yield of 4.0%, with a payout ratio of only 39%. PNC is trading at a nearly 10-year low price-to-earnings ratio of 10.4.
- 09/29/2022
|
PNC Financial (PNC) Acquires Linga, Boosts Payment Technology
- In efforts to fortify its payment capabilities, PNC Financial (PNC) acquires POS and payment solutions Linga. It will introduce the latter's technologies into the bank's ecosystem.
- 09/28/2022
|
Regional Banks Could Face New Regulations: What You Need to Know
- Regional banks could face rules similar to their bigger peers. Here's what regulators are proposing.
- 09/28/2022
|
PNC Acquires Linga in Move to Expand Corporate Payments
- The PNC Financial Services Group is acquiring Linga, a point of sale (POS) solutions firm, to further its expansion of corporate payments capabilities while enhancing its ability to serve hospitality and restaurant industry clients.
- 09/26/2022
|
Senators drill down on Zelle reimbursements, inflation and ‘uber-woke' policies in bank CEO hearing
- Democratic senators criticized banks for not serving consumers fairly while Republicans complained about liberal social agendas promoted by the same institutions, as chief executive officers of the country's seven largest consumer-facing banks sat for a second day of testimony on Capitol Hill on Thursday.
- 09/22/2022
|
Watch Jamie Dimon and other bank CEOs get grilled by Congress in second day of hearings
- The banking industry's top leaders face another day of hearings in Washington D.C.
- 09/22/2022
|
Congress grills big bank CEOs on compliance, diversity, and the economy
- Yahoo Finance's Alexandra Semenova breaks down what to expect from the big bank CEOs' congressional testimonies.
- 09/21/2022
|
Bank CEOs push back on capital requirements in Capitol Hill hearings
- Chief executive officers of the country's seven largest consumer-facing banks tackled queries on inflation, racial equality in home lending, regulatory burdens and their views on an economic slowdown as two days of public hearings on Capitol Hill got under way Wednesday.
- 09/21/2022
|
America's bank CEOs address the House Financial Services Committee
- CNBC's Leslie Picker joins 'Squawk on the Street' to outline the scope of today's big bank hearing at the House Financial Services Committee, which will feature 7 CEOs from America's largest consumer banks.
- 09/21/2022
|
Banks head to Capitol Hill
- CNBC's Leslie Picker reports on the bank CEOs testifying tomorrow on Capitol Hill. With CNBC's Melissa Lee and the Fast Money traders, Tim Seymour, Dan Nathan, Jeff Mills and Julie Biel.
- 09/20/2022
|
Bank CEOs are heading to Capitol Hill this week for their annual grilling
- CEOs from the largest consumer-facing banks in the U.S. are scheduled to testify on Capitol Hill this week in both the House and Senate as the fall midterm election season heats up and a stack of proposed banking bills await potential action.
- 09/19/2022
|
Congress Calls Bank CEOs to Capitol Hill for Annual Interrogation
- The leaders of the country's seven biggest commercial financial institutions will head to Washington, D.C., this week to face two Congressional hearings to review consumer protection and compliance issues, enforcement actions and recidivism, and trends and developments in the industry.
- 09/19/2022
|
Report: U.S. Banking Regulators Watching Big Regional Banks
- Large regional banks may be required to increase their financial cushions so they can better weather any crises that may emerge, the Wall Street Journal reported Sunday (Sept. 18).
- 09/18/2022
|
The regional banks have low cost deposits and margins that will improve, says RBC's Cassidy
- Gerard Cassidy, RBC Capital Markets head of U.S. bank equity strategy and large cap bank analyst, joins 'The Exchange' to discuss the big banks if M&A activity slows down, which banks investors should consider and more.
- 09/14/2022
|
THE PNC FINANCIAL SERVICES GROUP ANNOUNCES THIRD QUARTER EARNINGS CONFERENCE CALL DETAILS
- PITTSBURGH , Sept. 13, 2022 /PRNewswire/ -- The PNC Financial Services Group, Inc. (NYSE: PNC) expects to issue financial results for the third quarter at approximately 6:45 a.m.
- 09/13/2022
|
The PNC Financial Services Group, Inc (PNC) Could Be a Great Choice
- Dividends are one of the best benefits to being a shareholder, but finding a great dividend stock is no easy task. Does The PNC Financial Services Group, Inc (PNC) have what it takes?
- 08/22/2022
|
Are You Looking for a High-Growth Dividend Stock?
- Dividends are one of the best benefits to being a shareholder, but finding a great dividend stock is no easy task. Does The PNC Financial Services Group, Inc (PNC) have what it takes?
- 08/05/2022
|
PayPal, Mastercard, Citi and Others Join New Economic Opportunity Coalition
- PayPal has joined the White House's new Economic Opportunity Coalition (EOC) to address economic disparities and move things forward for various underserved communities, the company said in a press release Thursday (July 28). The coalition will include 21 corporations and three foundations, working on aligning major investments for communities of color.
- 07/28/2022
|
6 Stocks to Buy as Inflation Surges
- Investors looking for more all-weather inflation winners need to look further afield to the second-order winners. And one class of stocks stands to gain, regardless of the economY.
- 07/22/2022
|
Why The PNC Financial Services Group, Inc (PNC) is a Great Dividend Stock Right Now
- Dividends are one of the best benefits to being a shareholder, but finding a great dividend stock is no easy task. Does The PNC Financial Services Group, Inc (PNC) have what it takes?
- 07/20/2022
|
PNC Financial Benefiting From A Hot Main Street And Valuation Is Better
- PNC Financial surpassed analyst expectations in Q2, but there was more pressure than expected on net interest margin and PNC will likely have to pay more to fund loan growth. Loan growth remains a key driver, with PNC outperforming the banking sector, and particularly with its C&I lending franchise.
- 07/19/2022
|
The PNC Financial Services Group, Inc. (PNC) CEO Bill Demchak on Q2 2022 Results - Earnings Call Transcript
- The PNC Financial Services Group, Inc. (NYSE:PNC ) Q2 2022 Results Conference Call July 15, 2022 8:00 AM ET Company Participants Bryan Gill - SVP, Director-IR Bill Demchak - Chairman, President & CEO Rob Reilly - EVP, CFO Conference Call Participants Gerard Cassidy - RBC Bill Carcache - Wolfe Research Ken Usdin - Jefferies Erika Najarian - UBS Mike Mayo - Wells Fargo Securities John Pancari - Evercore ISI Bryan Gill Good morning, and welcome to today's conference call for the PNC Financial Services Group. Participating on this call are PNC's Chairman, President and CEO, Bill Demchak; and Rob Roley, Executive Vice President and CFO.
- 07/15/2022
|
Bank Name Reports Earnings Win, Revenue Miss
- One of the latest bank names to report earnings this week is PNC Financial Services Inc (NYSE:PNC).
- 07/15/2022
|
PNC reports mixed earnings, BlackRock inflows hit $90 billion in Q2
- Yahoo Finance Live anchors Julie Hyman and Brian Sozzi discuss quarterly earnings for PNC and BlackRock.
- 07/15/2022
|
PNC Financial (PNC) Q2 Earnings & Revenues Beat Estimates
- Higher net interest income and loan growth support PNC Financial's (PNC) Q2 results against headwinds like higher expenses and a declining deposit.
- 07/15/2022
|
The PNC Financial Services Group, Inc (PNC) Q2 Earnings and Revenues Beat Estimates
- The PNC Financial Services Group, Inc (PNC) delivered earnings and revenue surprises of 9.97% and 0.27%, respectively, for the quarter ended June 2022. Do the numbers hold clues to what lies ahead for the stock?
- 07/15/2022
|
PNC Q2 Preview: 8th Consecutive EPS Beat on Its Way?
- PNC has consistently reported strong bottom-line results, exceeding EPS estimates in 18 of its last 20 quarterly reports.
- 07/13/2022
|
Loans, Fee Income to Aid PNC Financial (PNC) Q2 Earnings
- Despite growth in asset management revenues, higher NII and loan growth, rising expenses are expected to have hurt PNC Financial's (PNC) Q2 earnings.
- 07/08/2022
|
Why The PNC Financial Services Group, Inc (PNC) is a Top Dividend Stock for Your Portfolio
- Dividends are one of the best benefits to being a shareholder, but finding a great dividend stock is no easy task. Does The PNC Financial Services Group, Inc (PNC) have what it takes?
- 07/04/2022
|
Daily Dividend Report: PNC Financial Services Group, Dupont, Lindsay, Watsco, Micron Technology
- Daily Dividend Report: PNC Financial Services Group, Dupont, Lindsay, Watsco, Micron Technology
- 07/01/2022
|
9 Stocks to Survive a “Dead Cat Bounce”
- Investors usually aren't big fans of financial stocks, but if you know how to pick the right ones, it's possible to find safe opportunities. The post 9 Stocks to Survive a “Dead Cat Bounce” appeared first on InvestorPlace.
- 06/29/2022
|
This Bank Stock Is a Must-Own for Any Dividend Investor
- This bank just raised its dividend by 20% to $1.50 per share
- 06/17/2022
|
7 Stocks to Buy Ahead of the June 23 Bank Stress Test Results
- Recession fears continue to drag bank stocks down, creating significant buying opportunities in financial shares. The post 7 Stocks to Buy Ahead of the June 23 Bank Stress Test Results appeared first on InvestorPlace.
- 06/16/2022
|
THE PNC FINANCIAL SERVICES GROUP ANNOUNCES SECOND QUARTER EARNINGS CONFERENCE CALL DETAILS
- PITTSBURGH , June 10, 2022 /PRNewswire/ -- The PNC Financial Services Group, Inc. (NYSE: PNC) expects to issue financial results for the second quarter at approximately 6:30 a.m. (ET), Friday, July 15, 2022, as previously announced.
- 06/10/2022
|
PNC EXECUTIVE TO SPEAK AT MORGAN STANLEY INVESTOR CONFERENCE
- PITTSBURGH , May 31, 2022 /PRNewswire/ -- The PNC Financial Services Group, Inc. (NYSE: PNC) announced today that Executive Vice President and Chief Financial Officer Robert Q. Reilly will discuss business performance, strategy and banking at 11 a.m.
- 05/31/2022
|
2 Dividend Stocks That Are Dirt Cheap Right Now
- These two banks are dependable dividend payers, and should benefit from rising interest rates.
- 05/13/2022
|
We do expect relief on inflation by late summer or early fall, says Matrix's David Katz
- David Katz, Matrix Asset Advisors president and chief investment officer, joins 'The Exchange' to discuss the Fed and inflation.
- 05/02/2022
|
Does PNC Financial Stock Belong in Your Portfolio?
- Financial services institution PNC Financial (NYSE: PNC) stock has retracing back down to oversold levels.
- 04/20/2022
|
Final Trades: GXO, Citi, PNC & more
- The "Halftime Report" traders give their top picks to watch for the second half.
- 04/19/2022
|
The PNC Financial Services Group, Inc. (PNC) CEO Bill Demchak on Q1 2022 Results - Earnings Call Transcript
- The PNC Financial Services Group, Inc. (NYSE:PNC ) Q1 2022 Results Conference Call April 14, 2022 11:00 AM ET Company Participants Bryan Gill - SVP, Director-IR Bill Demchak - President, CEO Rob Reilly - EVP, CFO Conference Call Participants Bill Carcache - Wolfe Research Gerard Cassidy - RBC John Pancari - Evercore ISI Mike Mayo - Wells Fargo Securities Scott Siefers - Piper Sandler Bryan Gill Welcome to today's conference of The PNC Financial Services Group. Participating on this call are PNC's Chairman, President and CEO, Bill Demchak; and Rob Reilly, Executive Vice President and CFO.
- 04/14/2022
|
The PNC Financial Services Group, Inc (PNC) Beats Q1 Earnings Estimates
- The PNC Financial Services Group, Inc (PNC) delivered earnings and revenue surprises of 18.35% and 1%, respectively, for the quarter ended March 2022. Do the numbers hold clues to what lies ahead for the stock?
- 04/14/2022
|
Key Factors to Impact PNC Financial's (PNC) Q1 Earnings
- Despite growth in asset management revenues, lower NII and fee income are expected to have acted as spoilsports for PNC Financial's (PNC) Q1 earnings.
- 04/12/2022
|
8 Upcoming Dividend Increases
- 8 Upcoming Dividend Increases
- 04/07/2022
|
Synovus Offers An Attractive Mix Of Organic And Macro Growth
- Synovus Offers An Attractive Mix Of Organic And Macro Growth
- 03/15/2022
|
THE PNC FINANCIAL SERVICES GROUP ANNOUNCES FIRST QUARTER 2022 EARNINGS CONFERENCE CALL AND VIRTUAL-ONLY ANNUAL SHAREHOLDERS MEETING DETAILS
- PITTSBURGH, March 10, 2022 /PRNewswire/ -- The PNC Financial Services Group, Inc. (NYSE: PNC) expects to issue financial results for the first quarter of 2022, Thursday, April 14, as previously announced, at approximately 6:45 a.m. (ET). PNC Chairman, President and Chief Executive Officer William S.
- 03/10/2022
|
Are You Looking for a High-Growth Dividend Stock? The PNC Financial Services Group, Inc (PNC) Could Be a Great Choice
- Dividends are one of the best benefits to being a shareholder, but finding a great dividend stock is no easy task. Does The PNC Financial Services Group, Inc (PNC) have what it takes?
- 03/01/2022
|
Reasons to Hold on to PNC Financial (PNC) Stock For Now
- PNC Financial's (PNC) strong balance sheet, inorganic expansion and sound capital deployment activities are positives. Yet, rising operating expenses and declining net interest margins ail.
- 02/25/2022
|
PNC EXECUTIVE TO SPEAK AT RBC CAPITAL MARKETS VIRTUAL INVESTOR CONFERENCE
- PITTSBURGH, Feb. 22, 2022 /PRNewswire/ -- The PNC Financial Services Group, Inc. (NYSE: PNC) announced today that Emma Loftus, executive vice president and head of Treasury Management, will discuss business performance, product capabilities and strategy at 1:20 p.m. (ET) Tuesday, March 8, at the virtual RBC Capital Markets Global Financial Institutions Conference.
- 02/22/2022
|
Asset Sensitivity, Loan Growth, And Operating Leverage Feeding Improving Sentiment For Wells Fargo
- Asset Sensitivity, Loan Growth, And Operating Leverage Feeding Improving Sentiment For Wells Fargo
- 02/21/2022
|
How Has PNC Performed 30 Days Post Earnings
- The PNC Financial Services Group, Inc (PNC) reported earnings 30 days ago. What's next for the stock?
- 02/17/2022
|
6 Financial Stocks I Recently Sold, And 2 I Will Hold For The Long Term
- I recently took profits in 6 financial stocks, most of which had performed very well since I bought them. I recently took profits in 6 financial stocks, most of which had performed very well since I bought them. This article explains the 3 factors that led me to place trailing stops on these stocks at the end of December.This article explains the 3 factors that led me to place trailing stops on these stocks at the end of December.
- 01/26/2022
|
Bank Stock Roundup: JPM, C, WFC, BAC & PNC in Focus on Q4 Earnings Beat
- Major banks, including JPM, C, WFC, BAC & PNC, surpass Q4 earnings estimates on revenue strength, solid loan balance and provision benefit. Yet, rising cost expectations lead to bearish investor sentiments.
- 01/21/2022
|
The PNC Financial Services Group, Inc (PNC) is a Top Dividend Stock Right Now: Should You Buy?
- Dividends are one of the best benefits to being a shareholder, but finding a great dividend stock is no easy task. Does The PNC Financial Services Group, Inc (PNC) have what it takes?
- 01/19/2022
|
Why I'm Taking Goliath Over the Digital Banking App Dave
- Dave initially received a $4 billion enterprise value, which looks way too high.
- 01/19/2022
|
The PNC Financial Services Group, Inc (PNC) CEO Bill Demchak on Q4 2021 Results - Earnings Call Transcript
- The PNC Financial Services Group, Inc (PNC) CEO Bill Demchak on Q4 2021 Results - Earnings Call Transcript
- 01/18/2022
|
PNC Financial (PNC) Q4 Earnings & Revenues Top Estimates
- PNC Financial's (PNC) Q4 results reflect the impacts of strong fee income growth and net interest income. Lower loans and escalating expenses have been spoilsports.
- 01/18/2022
|
Earnings: Goldman Sachs profit slips, BNY Mellon posts Q4 beat, PNC and Truist beat EPS estimates
- Truist Yahoo Finance's Brian Cheung discusses the earnings reports for Goldman Sachs, BNY Mellon, PNC, and Truist.
- 01/18/2022
|
Goldman Sachs, PNC Financial, Truist Financial, And Bank Of NY Mellon Report Mixed Earnings Results
- The rising two-year Treasury yield moves over 1% sparking concern that the Fed may have to raise rates higher than previously expected.
- 01/18/2022
|
The PNC Financial Services Group, Inc (PNC) Q4 Earnings and Revenues Top Estimates
- The PNC Financial Services Group, Inc (PNC) delivered earnings and revenue surprises of 1.94% and 0.48%, respectively, for the quarter ended December 2021. Do the numbers hold clues to what lies ahead for the stock?
- 01/18/2022
|
5 Large-Cap Stocks Likely to Gain From Q4 Earnings This Week
- Five large-cap companies will report fourth-quarter 2021 earnings results this week. These are: DFS, UAL, AAL, PNC and TRV.
- 01/17/2022
|
5 Regional Bank Earnings Charts to Watch Next Week
- The banks are going to be a big story in 2022. Which regional banks should be on your radar?
- 01/13/2022
|
What's in the Offing For PNC Financial (PNC) in Q4 Earnings?
- While loan growth and higher fee income are expected to have driven PNC Financial's (PNC) Q4 revenues, rising expenses on integration costs are likely to have played spoilsports.
- 01/12/2022
|
Is a Surprise Coming for PNC Financial (PNC) This Earnings Season?
- PNC Financial (PNC) is seeing favorable earnings estimate revision activity and has a positive Zacks Earnings ESP heading into earnings season.
- 01/12/2022
|
The PNC Financial Services Group, Inc (PNC) Earnings Expected to Grow: Should You Buy?
- The PNC Financial Services Group, Inc (PNC) possesses the right combination of the two key ingredients for a likely earnings beat in its upcoming report. Get prepared with the key expectations.
- 01/11/2022
|
Jason Snipe reveals his top two stocks for 2022
- A day after JPMorgan's Jamie Dimon said the U.S. Federal Reserve should raise rates at least four times in 2022, Odyssey Capital Advisors' Jason Snipe says the PNC Financial Services Group Inc (NYSE: PNC) will do good in such an economic environment. Why Snipe likes PNC Financial for 2022?
- 01/11/2022
|
Jason Snipe's top stock picks: Chevron, Qualcomm, PNC Financial
- Jason Snipe, Odyssey Capital Advisors principal and chief investment officer, joins the 'Halftime Report' to discuss his top stock picks.
- 01/11/2022
|
Buy This Dividend Stock Today and Relax
- If you're looking for income, PNC Financial pays out a hefty dividend.
- 01/11/2022
|
EVT: 6.68% Distribution Yield With A Solid Portfolio
- EVT: 6.68% Distribution Yield With A Solid Portfolio
- 01/10/2022
|
Hang On To The Regional Banks As A Safe Haven In A Rocky, Rate-Driven Market
- 2021 represented a recapture of prior years' underperformance where the regional banks outperformed the major indices (KBW Bank Index +36% vs. S&P 500 Index +28% and Nasdaq +22% in 2021). Bank relative P/Es at a cyclical low vs. the S&P despite their attractive prospects in a volatile rising rate environment.
- 12/30/2021
|
A Trio of Low Price-Book Ratio Stocks
- Screening for stocks with market caps over $10 billion and price-book ratios under 1.5 could provide a good starting place to value investors as they seek to spot opportunities amid the myriad of U.S.-listed stocks. Thus, value investors may want to consider the following stocks, as they match the criteria above and are recommended by Wall Street.
- 12/22/2021
|
PNC Financial Services Stock (PNC): $240 Price Target From UBS
- The shares of PNC Financial Services Group Inc (NYSE: PNC) have received a $240 price target from UBS. These are the details.
- 12/12/2021
|
UBS's Erika Najarian thinks this is a golden era for bank stocks
- Erika Najarian, UBS managing director, joins 'Power Lunch' to discuss how banks stand to be impacted from today's 39-year inflation highs.
- 12/10/2021
|
The PNC Financial Services Group Announces Fourth Quarter And Full Year Earnings Conference Call Details
- PITTSBURGH, Dec. 9, 2021 /PRNewswire/ -- The PNC Financial Services Group, Inc. (NYSE: PNC) expects to issue financial results for the fourth quarter and full year 2021, at approximately 6:45 a.m. (ET), Tuesday, Jan. 18, 2022, as previously announced.
- 12/09/2021
|
Recording Of The PNC Goldman Sachs Conference Presentation To Be Available, Following Technical Difficulties With The Conference Webcast Provider
- PITTSBURGH, Dec. 7, 2021 /PRNewswire/ -- The PNC Financial Services Group, Inc. (NYSE: PNC) will make a recording available of its presentation at the Goldman Sachs US Financial Services Conference after technical difficulties were experienced by the conference's webcast provider, which made the live presentation inaccessible. A recording of the presentation will be made available at approximately 8:00 p.m.
- 12/07/2021
|
2021's Top Value Stock Superstars
- It's been a great year for value investors as cheap stocks like Diamondback Energy and Dick's Sporting Goods have soared over 100%.
- 12/02/2021
|
After Absorbing BBVA USA, PNC Is Well Positioned to Profit
- The bank can now begin to work on cost savings and is also seeing some good signs of renewed loan growth.
- 10/27/2021
|
Bank Stock Roundup: PNC, TFC, FITB, BK, CMA & KEY in Focus on Q3 Earnings Beat
- Major banks including PNC, TFC, FITB, BK, CMA, & KEY surpass Q3 earnings estimates on robust fee income growth, a modest rise in loan demand, and reserve releases. An upbeat management outlook leads to bullish investor sentiments.
- 10/22/2021
|
Tips on Where to Invest as Rates Rise
- Think you know what might go on with the Fed and rates next year? Think again.
- 10/20/2021
|
Harris Williams Advises Agape Care Group on its Sale to Ridgemont Equity Partners
- RICHMOND, Va.--(BUSINESS WIRE)--Harris Williams, a global investment bank specializing in M&A advisory services, announces it advised Agape Care Group (Agape Care), a portfolio company of The Vistria Group (Vistria), on its sale to Ridgemont Equity Partners (Ridgemont). Agape Care is a leader in hospice and palliative care in the Southeast. The transaction was led by James Clark, Taylor Will and Jonathan Ferrell of the Harris Williams Healthcare & Life Sciences (HCLS) Group. “The qualit
- 10/19/2021
|
Recap: PNC Financial Services Q3 Earnings
- PNC Financial Services Gr(NYSE:PNC) stock rose by 0.86% on Monday after the company reported its Q3 earnings results on Friday, October 15, 2021 at 06:45 AM. Here's what investors need to know about the announcement.
- 10/19/2021
|
Harris Williams Advises ESG Operations, Inc. on its Merger with Inframark LLC
- RICHMOND, Va.--(BUSINESS WIRE)--Harris Williams, a global investment bank specializing in M&A advisory services, announces it advised ESG Operations, Inc. (ESG) on its merger with Inframark LLC (Inframark), a leading independent provider of outsourced infrastructure services focused on operation and maintenance (O&M) of water and wastewater systems. ESG provides full-service operation, maintenance, management and consulting services to governmental and private sector entities, principal
- 10/18/2021
|
PNC Financial (PNC) Q3 Earnings & Revenues Top Estimates
- PNC Financial's (PNC) Q3 results reflect the impacts of strong fee income growth and net interest income. Lower loans and deposit balances have been spoilsports.
- 10/15/2021
|
Earnings roundup: Alcoa, J.B. Hunt, & PNC all beat estimates for Q3
- Yahoo Finance's Brian Sozzi and Julie Hyman break down Q3 earnings for Alcoa, J.B. Hunt, and PNC.
- 10/15/2021
|
Goldman Sachs, PNC, And Truist Lead Another Group Of Financial Earnings Announcements
- Financial stocks have not disappointed in kicking off earnings and JB Hunt earnings provides new economic insights.
- 10/15/2021
|
PNC Reports Third Quarter 2021 Net Income Of $1.5 Billion, $3.30 Diluted EPS Or $3.75 As Adjusted
- PITTSBURGH, Oct. 15, 2021 /PRNewswire/ -- The PNC Financial Services Group, Inc. (NYSE: PNC) today reported: For the quarter In millions, except per share data and as noted 3Q21 2Q21 3Q20 Third Quarter Highlights ▪ Converted BBVA USA customers, employees, systems and branches as of October 12, 2021 – Third quarter results reflect full quarter benefit from BBVA USA – Second quarter results include one month impact of BBVA USA which closed on June 1, 2021 ▪ Diluted EPS as adjusted was $3.75, excluding $243 million of pre-tax integration costs related to BBVA USA ▪ Revenue increased 11% linked quarter driven by the full quarter benefit of BBVA USA and strong fee income growth ▪ Expenses increased 18% linked quarter. PNC legacy expenses increased 3% linked quarter, reflecting increased business activity ▪ Provision recapture of $203 million, reflecting improved credit quality and changes in portfolio composition ▪ Average loans and deposits increased 14% and 13%, respectively, linked quarter due to the full quarter benefit of BBVA USA ▪ Strong credit performance; net loan charge-offs of $81 million, decreased $225 million linked quarter Financial Results Revenue $ 5,197 $ 4,667 $ 4,281 Noninterest expense 3,587 3,050 2,531 Pretax, pre-provision earnings (non-GAAP) 1,610 1,617 1,750 Integration costs 243 111 — Pretax, pre-provision earnings excluding integration costs (non-GAAP) 1,853 1,728 — Provision for (recapture of) credit losses (203) 302 52 Net income 1,490 1,103 1,532 Per Common Share Diluted earnings - as reported $ 3.30 $ 2.43 $ 3.39 Impact from integration costs (non-GAAP) (0.45) (0.21) — Diluted earnings - as adjusted (non-GAAP) 3.75 2.64 — Book value 121.16 120.25 117.44 Tangible book value (non-GAAP) 94.82 93.83 95.71 Balance Sheet & Credit Quality Average loans (in billions) $ 291.3 $ 255.6 $ 253.1 Average deposits (in billions) 454.4 401.7 350.5 Net loan charge-offs 81 306 155 Allowance for credit losses to total loans 2.07 % 2.16 % 2.58 % Selected Ratios Return on average common equity 10.95 % 8.32 % 11.76 % Return on average assets 1.06 0.88 1.32 Net interest margin (non-GAAP) 2.27 2.29 2.39 Noninterest income to total revenue 45 45 42 Efficiency 69 65 59 Efficiency excluding integration costs (non-GAAP) 64 63 — Common Equity Tier 1 capital ratio 10.2 10.1 11.7 Diluted earnings as adjusted is a non-GAAP measure calculated by excluding post-tax integration costs for BBVA USA.
- 10/15/2021
|
Harris Williams Advises Vantage Elevator Solutions on its Pending Majority Sale to Ontario Teachers' Pension Plan Board
- RICHMOND, Va.--(BUSINESS WIRE)--Harris Williams, a global investment bank specializing in M&A advisory services, announces it is serving as lead financial advisor to Vantage Elevator Solutions (Vantage), a portfolio company of Golden Gate Capital, on its pending majority sale to Ontario Teachers' Pension Plan Board (Ontario Teachers'). As part of the transaction, Vantage's current owner, Golden Gate Capital, will retain a significant minority ownership stake in the company. Vantage is a lea
- 10/13/2021
|
PNC Stock Nabs Fresh All-Time High Ahead of Earnings
- The shares of PNC Financial Services Group, Inc. (NYSE: PNC) are down 0.7% at $201.80 at last check, cooling down from a recent Oct. 11, all-time high of $204.93.
- 10/13/2021
|
PNC Achieves National Expansion With Conversion Of BBVA USA
- PITTSBURGH, Oct. 12, 2021 /PRNewswire/ -- The PNC Financial Services Group, Inc. (NYSE: PNC) today announced it has completed the conversion of 2.6 million customers, 9,000 employees and nearly 600 branches across seven states from BBVA USA to PNC Bank. Experience the interactive Multichannel News Release here: https://www.multivu.com/players/English/8967151-pnc-achieves-national-expansion-with-conversion-bbva-usa/ The simultaneous conversion of BBVA USA customers and employees to PNC's network and platforms was completed, and BBVA USA branches in Texas, Alabama, Arizona, California, Florida, Colorado and New Mexico reopened October 12, as PNC Bank locations.
- 10/12/2021
|
What's in the Offing for PNC Financial's (PNC) Q3 Earnings?
- PNC Financial's (PNC) Q3 earnings are likely to reflect the impact of the low-rate environment and decreased net interest income.
- 10/12/2021
|
Harris Williams Advises DDW The Color House on its Pending Sale to Givaudan
- RICHMOND, Va.--(BUSINESS WIRE)--Harris Williams, a global investment bank specializing in M&A advisory services, announces it is advising DDW The Color House (DDW), a global privately held company specializing in natural color solutions for the food and beverage industry, on its pending sale to Givaudan, a global leader in fragrances and flavors. The transaction is being led by Tim Alexander, Brant Cash, Andy Warczak and David Stead of the Harris Williams Consumer Group. “DDW is a pioneer i
- 10/11/2021
|
5 Large-Cap Stocks Likely to Gain From Q3 Earnings This Week
- Five corporate bigwigs are slated to release third-quarter earnings results this week. These are: JPM, BAC, PNC, USB and UNH.
- 10/11/2021
|
The PNC Financial Services Group, Inc (PNC) Earnings Expected to Grow: What to Know Ahead of Next Week's Release
- The PNC Financial Services Group, Inc (PNC) doesn't possess the right combination of the two key ingredients for a likely earnings beat in its upcoming report. Get prepared with the key expectations.
- 10/08/2021
|
This Large Bank Merger Just Got Riskier
- A deal that would create a bank with more than $100 billion in assets has now been delayed, as the two parties await approval from the Federal Reserve.
- 10/07/2021
|
PNC Financial (PNC) Teams Up With Akoya for Financial Data Security
- PNC Financial (PNC) collaborates with Akoya to enhance security of data for customers transacting with Fintech applications.
- 10/04/2021
|
PNC Financial: Solid Operations Provide A Compelling Entry Point
- Over the next few quarters, PNC's tangible book value growth rate is likely to prove superior to peers. Core profitability looks likely to improve off current levels.
- 10/04/2021
|
PNC Launches Akoya Solution To Increase The Security Of Connections For Consumers To Safely Transact With Financial Apps
- PITTSBURGH, Sept. 30, 2021 /PRNewswire/ -- PNC Bank and Akoya LLC today announced the bank's integration with the Akoya Data Access Network.
- 09/30/2021
|
Looking for Earnings Suprise? Play These 5 Stocks
- Bet big on the concept positive earnings surprise rather than earnings growth through these 5 stocks.
- 09/30/2021
|
Harris Williams Advises Summit Interconnect, Inc. on its Sale to Affiliates of Lindsay Goldberg
- RICHMOND, Va.--(BUSINESS WIRE)--Harris Williams, a global investment bank specializing in M&A advisory services, announces it advised Summit Interconnect, Inc. (Summit), a portfolio company of HCI Equity Partners (HCI), on its sale to affiliates of Lindsay Goldberg. Summit is a leading provider of complex printed circuit boards focused on defense, space and high-performance commercial sectors in the North American market. The transaction was led by Chris Rogers, Chris Smith, Evan Clark and
- 09/27/2021
|
Small Business Optimism Hits Record High, Gaining Momentum From Vaccines And Adapted Pandemic Operations, PNC Survey Shows
- PITTSBURGH, Sept. 27, 2021 /PRNewswire/ -- Business owners are feeling optimistic about the near-term future of their businesses amid increasing vaccination rates, and those who report that more than three-quarters of their workforce has been vaccinated are the most positive about their business outlook.
- 09/27/2021
|
This Deal Makes a Great Business Stronger
- U.S. Bancorp is building on its core strategy with one of its most significant acquisitions ever.
- 09/24/2021
|
Harris Williams Advises Hunt Valve Company on its Sale to Fairbanks Morse Defense
- RICHMOND, Va.--(BUSINESS WIRE)--Harris Williams, a global investment bank specializing in M&A advisory services, announces it advised Hunt Valve Company (Hunt Valve), a portfolio company of May River Capital, on its sale to Fairbanks Morse Defense (Fairbanks Morse), a portfolio company of Arcline Investment Management (Arcline). Hunt Valve designs and manufactures complex valves and electromechanical actuators that support critical system functions onboard key U.S. Navy platforms. The trans
- 09/14/2021
|
PNC Bank Launches Project 257: Accelerating Women's Financial Equality
- PITTSBURGH, Sept. 14, 2021 /PRNewswire/ -- PNC Bank announced today the launch of Project 257 ℠ : Accelerating Women's Financial Equality, an initiative designed to help close the 257-year economic gender gap and expand on PNC's decades-long track record of supporting female financial decision makers.
- 09/14/2021
|
PNC Announces Amanda Rosseter As Chief Communications Officer
- PITTSBURGH, Sept. 8, 2021 /PRNewswire/ -- The PNC Financial Services Group, Inc. (NYSE: PNC) today announced that Amanda Rosseter has joined the company as chief communications officer.
- 09/08/2021
|
Harris Williams Advises Deacom on its Sale to ECI Software Solutions
- RICHMOND, Va.--(BUSINESS WIRE)--Harris Williams, a global investment bank specializing in M&A advisory services, announces it advised Deacom, Inc. (Deacom) on its sale to ECI Software Solutions (ECI), a portfolio company of Leonard Green & Partners, L.P. (LGP) and funds advised by Apax Partners LLP (Apax). Deacom is a leading cloud-based enterprise resource planning (ERP) software provider for process manufacturers and distribution companies. The transaction was led by the Harris Willia
- 09/02/2021
|
Harris Williams Advises Tecta America Corporation on its Minority Investment from Leonard Green & Partners
- RICHMOND, Va.--(BUSINESS WIRE)--Harris Williams, a global investment bank specializing in M&A advisory services, announces it advised Tecta America Corporation (Tecta America), a portfolio company of Altas Partners (Altas), on its minority investment from Leonard Green & Partners (LGP). Altas is retaining majority ownership in the company. Tecta America is a national leader in commercial roofing services in the U.S. The transaction was led by Bob Baltimore, Brian Lucas, Taylor Morris an
- 09/01/2021
|
Harris Williams Advises SavATree on its Pending Sale to the Apax Funds
- RICHMOND, Va.--(BUSINESS WIRE)--Harris Williams, a global investment bank specializing in M&A advisory services, announces it is advising SavATree, a portfolio company of CI Capital Partners LLC (CI Capital), on its pending sale to funds advised by Apax (the Apax Funds). SavATree is a leading professional tree, shrub and lawn care provider. The transaction is being led by Brent Spiller and Zach Ledwith of the Harris Williams Consumer Group and Brian Lucas, Bryce Walker and Sam Funkhouser of
- 08/31/2021
|
PNC Executives To Speak At Barclays Global Financial Services Virtual Conference
- PITTSBURGH, Aug. 31, 2021 /PRNewswire/ -- The PNC Financial Services Group, Inc. (NYSE: PNC) announced today that Chairman, President and Chief Executive Officer William S. Demchak and Executive Vice President and Chief Financial Officer Robert Q.
- 08/31/2021
|
PNC Bank Announces Minimum Pay Rate Increase
- PITTSBURGH, Aug. 30, 2021 /PRNewswire/ -- PNC Bank announced that it will bring its minimum pay rate from $15 to $18 per hour, beginning Nov. 22, 2021. This represents a 20% increase from the bank's current $15 minimum rate and is more than double the national minimum wage of $7.25.
- 08/30/2021
|
Wells Fargo Marking Time Before Regulatory-Driven Growth Re-Acceleration
- Wells Fargo Marking Time Before Regulatory-Driven Growth Re-Acceleration
- 08/23/2021
|
Bank Of America Fueled Up And Ready To Go When Rates Cooperate
- Bank Of America Fueled Up And Ready To Go When Rates Cooperate
- 08/18/2021
|
Harris Williams Advises Myers Emergency Power Systems on its Sale to Kohlberg & Company, L.L.C.
- RICHMOND, Va.--(BUSINESS WIRE)--Harris Williams, a global investment bank specializing in M&A advisory services, announces it advised Myers Emergency Power Systems (Myers EPS), a portfolio company of Graham Partners, on its sale to Kohlberg & Company, L.L.C. (Kohlberg). Myers EPS is a leading provider of mission-critical, legally mandated emergency power and smart controls technologies. The transaction was led by Eric Logue, Giles Tucker and Chris Toussaint of the Harris Williams Indust
- 08/18/2021
|
PNC Pledges $20 Billion In Environmental Finance
- PITTSBURGH, Aug. 18, 2021 /PRNewswire/ -- The PNC Financial Services Group, Inc. (NYSE: PNC) announced today it is committing $20 billion over five years in support of environmental finance. This commitment is an extension of PNC's long-standing support for accelerating the transition to a low-carbon economy, and is complementary to the bank's recently announced Community Benefits Plan, which pledges $88 billion in loans, investments, and other financial support to bolster economic opportunity for low- and moderate-income (LMI) individuals and communities, people and communities of color, and other underserved individuals and communities.
- 08/18/2021
|
Harris Williams Advises RQM+ on its Sale to Linden Capital Partners
- RICHMOND, Va.--(BUSINESS WIRE)--Harris Williams, a global investment bank specializing in M&A advisory services, announces it advised RQM+, a portfolio company of DFW Capital Partners (DFW) and Chartwell Investments Entrepreneur & Founder Capital (Chief Capital), on its sale to Linden Capital Partners (Linden). RQM+ provides regulatory and quality consulting and engineering for medical devices, in vitro diagnostics and combination products. The transaction was led by Paul Hepper, Nick O
- 08/16/2021
|
2 Cheap Dividend Stocks You Can Buy Right Now
- Both of these stocks deliver higher-than-average dividend yields and recently made acquisitions.
- 08/14/2021
|
Final Trades: PNC, Coca-Cola, Air Products & more
- The "Halftime Report" traders give their top picks to watch for the second half.
- 08/13/2021
|
Why Is The PNC Financial Services Group, Inc (PNC) Up 2.1% Since Last Earnings Report?
- The PNC Financial Services Group, Inc (PNC) reported earnings 30 days ago. What's next for the stock?
- 08/13/2021
|
PNC Issues Inaugural Social Bond
- PITTSBURGH, Aug. 13, 2021 /PRNewswire/ -- The PNC Financial Services Group, Inc. (NYSE: PNC) announced today the closing of its inaugural social bond. The proceeds will be used to finance or re-finance Eligible Social Projects that promote positive social outcomes and that benefit low- to moderate-income (LMI) individuals and communities, majority-minority census tracts, and/or vulnerable or underserved populations.
- 08/13/2021
|
Harris Williams Advises Collision Works on its Sale to The Boyd Group Inc.
- RICHMOND, Va.--(BUSINESS WIRE)--Harris Williams, a global investment bank specializing in M&A advisory services, announces it advised Collision Works of Oklahoma, LLC (Collision Works), a full service collision repair company, on its sale to The Boyd Group Inc. (Boyd Group), a Canadian-based company that operates under the trade name Gerber Collision & Glass in the U.S. The transaction was led by Joe Conner, Elliott Yousefian, Michael Meyer and Sam Funkhouser of the Harris Williams Tran
- 08/12/2021
|
Harris Williams Advises Social Solutions Global on its Pending Sale to Apax Partners LLP
- RICHMOND, Va.--(BUSINESS WIRE)--Harris Williams, a global investment bank specializing in M&A advisory services, announces it is advising Social Solutions Global (Social Solutions), a portfolio company of Vista Equity Partners (Vista), on its pending sale to Apax Partners LLP (Apax). Social Solutions is a leading cloud software provider for nonprofit and public sector social service organizations. The pending sale of Social Solutions is part of a three-company merger alongside CyberGrants a
- 08/06/2021
|
Harris Williams Advises Worldwide Express, LLC on its Sale to CVC Capital Partners
- RICHMOND, Va.--(BUSINESS WIRE)--Harris Williams, a global investment bank specializing in M&A advisory services, announces it advised Worldwide Express, LLC (Worldwide Express), a portfolio company of Ridgemont Equity Partners (Ridgemont), on its sale to CVC Capital Partners (CVC). Worldwide Express is a leading provider of third-party logistics (3PL) services. CVC will merge Worldwide Express with GlobalTranz Enterprises, LLC (GlobalTranz), another leading non-asset based provider of 3PL s
- 07/27/2021
|
Harris Williams Advises Pamplona Capital Management on its Pending Sale of BakeMark USA, LLC to Clearlake Capital Group, L.P.
- RICHMOND, Va.--(BUSINESS WIRE)--Harris Williams, a global investment bank specializing in M&A advisory services, announces it is advising Pamplona Capital Management (Pamplona) on its pending sale of BakeMark USA, LLC (BakeMark) to Clearlake Capital Group, L.P. (Clearlake). BakeMark is a category leader in the baking industry, with quality products, quick delivery and strong R&D capabilities. The transaction is being led by Tim Alexander, Brant Cash, Andy Warczak and David Stead of the
- 07/22/2021
|
PNC Announces Redemption Of 3.250 Percent Senior Notes Due September 3, 2021
- PITTSBURGH, July 22, 2021 /PRNewswire/ -- The PNC Financial Services Group, Inc. (NYSE: PNC) today announced the redemption on Aug. 4, 2021 of all of the outstanding Senior Notes due Sept. 3, 2021 issued by PNC in the amount of $500,000,000 (CUSIP 693475AU9).
- 07/22/2021
|
Truist Seeing Some Short-Term Pressures, But The Long-Term Opportunity Is Attractive
- Truist Seeing Some Short-Term Pressures, But The Long-Term Opportunity Is Attractive
- 07/22/2021
|
PNC Financial's Core Operations Still Under Some Pressure, But The Future Is Bright
- PNC reported better than expected second quarter results, but didn't beat on the lines (net interest income margin, loans) where investors were really hoping to see upside. High cash balances among corporate clients is limiting loan demand, but spreads and loan demand should improve later in 2021 and into 2022, creating more growth and operating leverage momentum.
- 07/21/2021
|
Bank Stock Roundup: JPM, WFC, BAC, C, TFC & PNC in Focus as Q2 Earnings Start
- Q2 earnings begin on a positive note with major banks like JPMorgan (JPM), BofA (BAC), Citi (C), Wells Fargo (WFC), PNC Financial (PNC) & Truist (TFC) outpacing estimates, mainly driven by reserve releases and decent fee income performance.
- 07/16/2021
|
The PNC Financial Services Group, Inc (PNC) Q2 Earnings and Revenues Top Estimates
- The PNC Financial Services Group, Inc (PNC) delivered earnings and revenue surprises of 42.41% and 5.59%, respectively, for the quarter ended June 2021. Do the numbers hold clues to what lies ahead for the stock?
- 07/14/2021
|
The PNC Financial Services Group, Inc. (PNC) CEO Bill Demchak on Q2 2021 Results - Earnings Call Transcript
- The PNC Financial Services Group, Inc. (PNC) CEO Bill Demchak on Q2 2021 Results - Earnings Call Transcript
- 07/14/2021
|
PNC Financial (PNC) Q2 Earnings & Revenues Beat Estimates
- PNC Financial's (PNC) Q2 performance highlights strong fee income growth and higher deposits.
- 07/14/2021
|
Recap: PNC Financial Services Q2 Earnings
- Shares of PNC Financial Services Gr (NYSE:PNC) decreased 0.5% in pre-market trading after the company reported Q2 results. Quarterly Results Earnings per share were up 336.84% over the past year to $4.50, which beat the estimate of $3.12.
- 07/14/2021
|
PNC Reports Second Quarter 2021 Net Income Of $1.1 Billion, $2.43 Diluted EPS
- PITTSBURGH, July 14, 2021 /PRNewswire/ -- The PNC Financial Services Group, Inc. (NYSE: PNC) today reported: For the quarter In millions, except per share data and as noted 2Q21 1Q21 2Q20 Second Quarter Highlights ▪ Closed the acquisition of BBVA USA on June 1, 2021 ▪ Second quarter results include one month impact of BBVA USA ▪ Adjusted EPS was $4.50, excluding the initial provision for credit losses and integration costs related to BBVA USA ▪ Revenue increased 11% linked quarter driven by the BBVA USA acquisition and strong PNC legacy noninterest income growth ▪ Expenses increased 18% linked quarter including integration expenses, increased business activity and litigation reserves ▪ Provision for credit losses was $302 million, as a provision recapture of $704 million was more than offset by a $1.0 billion initial provision for BBVA USA ▪ Total loans and deposits increased 24% and 21%, respectively, linked quarter due to the BBVA USA acquisition ▪ Solid credit performance; acquired net loan charge-offs of $248 million were primarily due to purchase accounting Financial Results Revenue $ 4,667 $ 4,220 $ 4,076 Noninterest expense 3,050 2,574 2,515 Pretax, pre-provision earnings (non-GAAP) 1,617 1,646 1,561 Provision for (recapture of) credit losses 302 (551) 2,463 Net income (loss) from continuing operations 1,103 1,826 (744) Per Common Share Diluted earnings (loss) from continuing operations - as reported $ 2.43 $ 4.10 $ (1.90) Diluted earnings (loss) from continuing operations - as adjusted (non-GAAP) 4.50 NA NA Book value 120.25 118.47 115.26 Tangible book value (non-GAAP) 93.83 96.57 93.54 Balance Sheet & Credit Quality Total loans (in billions) $ 294.7 $ 237.0 $ 258.2 Total deposits (in billions) 452.9 375.1 346.0 PNC legacy net loan charge-offs 58 146 236 Acquired net loan charge-offs 248 NA NA Allowance for credit losses to total loans 2.16 % 2.20 % 2.55 % Selected Ratios Return on average common equity 8.32 % 14.31 % 30.11 % Return on average assets 0.88 1.58 3.21 Net interest margin (non-GAAP) 2.29 2.27 2.52 Noninterest income to total revenue 45 44 38 Efficiency 65 61 62 Common Equity Tier 1 capital ratio 10.0 12.6 11.3 Adjusted EPS is a non-GAAP measure calculated by excluding the initial provision for credit losses for BBVA USA recorded on June 1, 2021 and integration costs. See this and other non-GAAP financial measures in the consolidated financial highlights accompanying this news release.
- 07/14/2021
|
Preview: PNC Financial Services Gr's Earnings
- PNC Financial Services Gr (NYSE:PNC) announces its next round of earnings this Wednesday, July 14. Here is Benzinga's look at PNC Financial Services Gr's Q2 earnings report.
- 07/13/2021
|
Is a Surprise Coming for PNC Financial (PNC) This Earnings Season?
- PNC Financial (PNC) is seeing favorable earnings estimate revision activity and has a positive Zacks Earnings ESP heading into earnings season.
- 07/09/2021
|
PNC Announces Redemption Of Senior Notes Due July 22, 2022
- PITTSBURGH, July 9, 2021 /PRNewswire/ -- The PNC Financial Services Group, Inc. (NYSE: PNC) today announced the redemption on July 22, 2021, of the following Senior Notes issued by PNC Bank, National Association: All outstanding Senior Fixed Rate/Floating Rate Notes due July 22, 2022, in the amount of $600,000,000 (CUSIP 69353RFP8). The securities have a distribution rate of 2.232% and an original scheduled maturity date of July 22, 2022.
- 07/09/2021
|
Harris Williams Advises Neighborly on its Pending Sale to KKR
- RICHMOND, Va.--(BUSINESS WIRE)--Harris Williams, a global investment bank specializing in M&A advisory services, announces it is advising Neighborly, a portfolio company of funds managed by Harvest Partners, LP (Harvest Partners), on its pending sale to KKR. Neighborly is the premier residential service provider focused on providing all the services that consumers need to repair, maintain and enhance their property. The transaction is being led by John Neuner, Brent Spiller, Trey Shehan, an
- 07/08/2021
|
Dividend Increases: June 26-July 2, 2021
- This weekly article series covers dividend changes. A summary table presents relevant data and key statistics of dividend increases.
- 07/07/2021
|
The PNC Financial Services Group, Inc (PNC) Reports Next Week: Wall Street Expects Earnings Growth
- The PNC Financial Services Group, Inc (PNC) possesses the right combination of the two key ingredients for a likely earnings beat in its upcoming report. Get prepared with the key expectations.
- 07/07/2021
|
Harris Williams Advises Tachyon Communication Services on its Sale to NextEdge, a Bow River Capital Portfolio Company
- RICHMOND, Va.--(BUSINESS WIRE)--Harris Williams, a global investment bank specializing in M&A advisory services, announces it advised SBS Services Holdings, LLC (doing business as Tachyon Communication Services; Tachyon), a portfolio company of MSouth Equity Partners (MSouth), on its merger with NEN Holdings, LLC (doing business as NextEdge Networks and Modus; NextEdge), a portfolio company of Bow River Capital (Bow River). Tachyon is a leading provider of wireless and wireline infrastructu
- 07/07/2021
|
PNC scores a double upgrade at Wolfe
- The "Halftime Report" traders debate Wolfe's bullish call on PNC.
- 07/02/2021
|
PNC Raises Common Dividend To $1.25 Per Share
- PITTSBURGH, July 1, 2021 /PRNewswire/ -- The board of directors of The PNC Financial Services Group, Inc. (NYSE: PNC) declared a quarterly cash dividend on the common stock of $1.25 per share, an increase of $0.10 per share, or 9%, from the second quarter dividend of $1.15 per share. The dividend will be payable Aug. 5, 2021, to shareholders of record at the close of business July 16, 2021.
- 07/01/2021
|
Harris Williams Advises ArchKey Solutions on its Significant Investment from One Rock Capital Partners
- RICHMOND, Va.--(BUSINESS WIRE)--Harris Williams, a global investment bank specializing in M&A advisory services, announces it advised ArchKey Solutions (ArchKey), a portfolio company of funds managed by Oaktree Capital Management, L.P. (Oaktree), on its significant investment from an affiliate of One Rock Capital Partners, LLC (One Rock). ArchKey is a premier electrical and technologies contracting and services provider. The transaction was led by Drew Spitzer, Matt White, Neha Shah, Marsha
- 06/30/2021
|
PNC Announces Stress Capital Buffer And Planned Capital Actions
- PITTSBURGH, June 28, 2021 /PRNewswire/ -- The PNC Financial Services Group, Inc. (NYSE: PNC) last week received the results of the Federal Reserve's 2021 Comprehensive Capital Analysis and Review (CCAR). The results included the Federal Reserve's estimate of PNC's minimum capital ratios for the period from the first quarter of 2021, through the first quarter of 2023, under the Supervisory Severely Adverse Scenario.
- 06/28/2021
|
Harris Williams Advises Artera Services, LLC on its Acquisition of Feeney Utility Services Group
- RICHMOND, Va.--(BUSINESS WIRE)--Harris Williams, a global investment bank specializing in M&A advisory services, announces it advised Artera Services, LLC (Artera), a portfolio company of Clayton, Dubilier & Rice (CD&R) and one of the nation's largest providers of integrated infrastructure services to natural gas and electric industries, on its acquisition of Feeney Utility Services Group (FUSG). The transaction was led by Drew Spitzer and Matt White of the Harris Williams Energy, P
- 06/28/2021
|
Harris Williams Advises JM Swank on its Pending Sale to Brenntag
- RICHMOND, Va.--(BUSINESS WIRE)--Harris Williams, a global investment bank specializing in M&A advisory services, announces it is advising JM Swank, a portfolio company of Platinum Equity, on its pending sale to Brenntag (XTRA:BNR). JM Swank is a leading U.S. food ingredient distributor with national reach. The transaction is being led by Tim Alexander, Brant Cash, Andy Warczak, Richard Furseth and Cam Cornwell of the Harris Williams Consumer Group. “JM Swank is widely recognized as a critic
- 06/23/2021
|
Harris Williams Advises H.I.G. Capital on its Acquisition of CORA Physical Therapy
- RICHMOND, Va.--(BUSINESS WIRE)--Harris Williams, a global investment bank specializing in M&A advisory services, announces it advised an affiliate of H.I.G. Capital (H.I.G.) on its acquisition of CORA Health Holdings Corp. and its subsidiaries, doing business as CORA Physical Therapy (CORA). CORA is a leading operator of outpatient physical and occupational therapy clinics. The transaction was led by Andy Dixon of the Harris Williams Healthcare & Life Sciences (HCLS) Group. CORA is an o
- 06/21/2021
|
PNC Financial Still Offers A Lot To Like As It Shifts To Recovery And Growth
- PNC isn't as levered to higher rates as some of its peers, but it has enough asset sensitivity to benefit, and the company's heavier exposure to commercial lending is positive. The Compass deal has already started outperforming expectations and the weaknesses at Compass (particularly relating to operating efficiency) are areas of particular strength for PNC.
- 06/17/2021
|
The PNC Financial Services Group Announces Second Quarter Earnings Conference Call Details
- PITTSBURGH, June 17, 2021 /PRNewswire/ -- The PNC Financial Services Group, Inc. (NYSE: PNC) expects to issue financial results for the second quarter at approximately 6:45 a.m. (ET), Wednesday, July 14, 2021, as previously announced.
- 06/17/2021
|
Harris Williams Advises American Dental Partners on its Sale to Heartland Dental
- RICHMOND, Va.--(BUSINESS WIRE)--Harris Williams, a global investment bank specializing in M&A advisory services, announces it advised American Dental Partners (ADPI), a portfolio company of JLL Partners (JLL), on its sale to Heartland Dental, a portfolio company of KKR. ADPI is one of the largest dental practice management companies in the United States. The transaction was led by James Clark, Whit Knier, Geoff Smith, Nathan Robertson and Bill Whitaker of the Harris Williams Healthcare &
- 06/16/2021
|
The PNC Financial Services Group Provides Fourth Quarter 2021 And Quarterly 2022 Earnings Release Dates
- PITTSBURGH, June 16, 2021 /PRNewswire/ -- The PNC Financial Services Group, Inc. (NYSE: PNC) announced today that it expects to issue quarterly earnings releases pre-market open and hold conference calls at the times indicated on the following dates: Fourth Quarter 2021 – Tuesday, Jan. 18, 2022 at 9:30 a.m. (ET) First Quarter 2022 – Thursday, April 14, 2022 at 11:00 a.m.
- 06/16/2021
|
Harris Williams Advises H.I.G. Capital on its Strategic Growth Investment in Cleo
- RICHMOND, Va.--(BUSINESS WIRE)--Harris Williams, a global investment bank specializing in M&A advisory services, announces it advised an affiliate of H.I.G. Capital (H.I.G.) on its strategic growth investment in Cleo. Cleo is a next generation cloud-based ecosystem integration platform that brings together end-to-end integration visibility across API, EDI and non-EDI integrations. The transaction was led by Erik Szyndlar, Andy Leed and Priyanka Naithani of the Harris Williams Technology Gro
- 06/15/2021
|
DailyPay, PNC Bank and The Clearing House Team up to Provide Real-time Access to Earned Pay for Millions of American Workers
- NEW YORK, June 15, 2021 /PRNewswire/ -- DailyPay, the leader in on-demand pay, has teamed up with PNC Bank and The Clearing House to offer real-time payments over the RTP ® network, creating the ability to fulfill employee payment needs 24/7/365 with unmatched speed and accuracy. "We are constantly exploring ways to innovate our industry-leading technology platform and build upon the gold-standard service we provide our client partners and their employees," said Ron Munkittrick, senior vice president, External Operations, DailyPay.
- 06/15/2021
|
Harris Williams Advises Visual Comfort & Co. on its Pending Investment from Goldman Sachs Asset Management and Leonard Green & Partners
- RICHMOND, Va.--(BUSINESS WIRE)--Harris Williams, a global investment bank specializing in M&A advisory services, announces it is advising Visual Comfort & Co., the premier resource for signature designer lighting, on its pending investment from Goldman Sachs Asset Management and Leonard Green & Partners (LGP). The investment is being made alongside Visual Comfort & Co.'s existing investment partner, AEA Investors LP (AEA). The transaction is being led by Corey Benjamin, John Neu
- 06/08/2021
|
Why investors should favor value over growth: Neuberger Berman's Eli Salzmann
- Eli Salzmann of the Neuberger Berman Large Cap Value Fund, discusses what he's watching in today's markets. For access to live and exclusive video from CNBC subscribe to CNBC PRO: https://cnb.cx/2NGeIvi » Subscribe to CNBC TV: https://cnb.cx/SubscribeCNBCtelevision » Subscribe to CNBC: https://cnb.cx/SubscribeCNBC » Subscribe to CNBC Classic: https://cnb.cx/SubscribeCNBCclassic Turn to CNBC TV for the latest stock market news and analysis.
- 06/04/2021
|
Wall Street should brace for 'larger than normal price swings,' PNC's chief investment officer warns
- PNC Financial's Amanda Agati lists stretched market valuations, Fed taper chatter and the end of stimulus checks as troubling forces in the market.
- 06/03/2021
|
PNC Closes BBVA USA Merger Deal, Boosts Nationwide Expansion
- In a bid to penetrate deeper into the national markets, PNC concludes its merger deal with BBVA USA on Jun 1, 2021.
- 06/02/2021
|
Harris Williams Advises Network Wireless Solutions on its Sale to Grain Management, LLC
- RICHMOND, Va.--(BUSINESS WIRE)--Harris Williams, a global investment bank specializing in M&A advisory services, announces it advised Network Wireless Solutions (NWS), a full-service distributor of mission-critical materials and logistics solutions to the wireless telecommunications industry, on its sale to Grain Management, LLC (Grain). The transaction was led by Bob Baltimore, Graham Gillam, Maury Nolen and Michael Tuohey of the Harris Williams Specialty Distribution Group. “NWS is recogn
- 06/02/2021
|
PNC Executives To Speak At Morgan Stanley Virtual Investor Conference
- PITTSBURGH, June 1, 2021 /PRNewswire/ -- The PNC Financial Services Group, Inc. (NYSE: PNC) announced today that Chairman, President and Chief Executive Officer William S. Demchak and Executive Vice President and Chief Financial Officer Robert Q.
- 06/01/2021
|
Harris Williams Advises Qualus Power Services on its Sale to New Mountain Capital
- RICHMOND, Va.--(BUSINESS WIRE)--Harris Williams, a global investment bank specializing in M&A advisory services, announces it advised Qualus Power Services (Qualus), a portfolio company of Mason Wells, on its sale to New Mountain Capital (New Mountain). Qualus is a leading provider of engineering and specialized technical field services to utility and private power grid infrastructure. The transaction was led by Drew Spitzer, Matt White, Ian Thomas, Thomas Saunders and Marshall Wills of the
- 06/01/2021
|
PNC Completes Acquisition of BBVA USA
- PITTSBURGH, June 1, 2021 /PRNewswire/ -- The PNC Financial Services Group, Inc. (NYSE: PNC) today announced the completion of its acquisition of BBVA USA Bancshares, Inc., including its U.S. banking subsidiary BBVA USA. Through this transaction, PNC is now the fifth largest U.S. commercial banking organization with over $560 billion in assets with a coast-to-coast national franchise that will provide a full range of products and services to retail customers and business clients in 29 of the top 30 largest markets in the country.
- 06/01/2021
|
PNC Executives To Speak At Bernstein Virtual Conference
- PITTSBURGH, May 20, 2021 /PRNewswire/ -- The PNC Financial Services Group, Inc. (NYSE: PNC) announced today that Chairman, President and Chief Executive Officer William S. Demchak and Executive Vice President and Chief Financial Officer Robert Q.
- 05/20/2021
|
Harris Williams Advises Transaction Data Systems on its Sale to BlackRock Long Term Private Capital
- RICHMOND, Va.--(BUSINESS WIRE)--Harris Williams, a global investment bank specializing in M&A advisory services, announces it advised Transaction Data Systems (TDS), a portfolio company of GTCR, on its sale to BlackRock Long Term Private Capital (BlackRock LTPC). TDS is a leader in pharmacy software solutions and services. The transaction was led by Sam Hendler, Dan Linsalata, Ryan Costa and Rebecca Evans of the Harris Williams Technology Group and Paul Hepper of the firm's Healthcare &
- 05/19/2021
|
Snow Capital Curbs PNC Financial, Exits AECOM
- Richard Snow (Trades, Portfolio)'s Snow Capital Management sold shares of the following stocks during the first quarter of 2021, which ended on March 31.
- 05/17/2021
|
PNC Financial (PNC) Gets Regulatory Nod for BBVA USA Merger Deal
- PNC Financial's (PNC) proposed acquisition of BBVA USA, as part of the bank's efforts to expand presence in international markets receives necessary regulatory approvals.
- 05/17/2021
|
PNC Receives Regulatory Approval For Acquisition Of BBVA USA
- PITTSBURGH, May 14, 2021 /PRNewswire/ -- The PNC Financial Services Group, Inc. (NYSE: PNC) today announced receipt of regulatory approval from the Board of Governors of the Federal Reserve System and the Office of the Comptroller of the Currency to complete the previously announced acquisition of BBVA USA Bancshares, Inc., including its U.S. banking subsidiary, BBVA USA. The regulatory approval process also included approvals from the Banking Departments of the States of Alabama and Texas.
- 05/14/2021
|
Fed approves acquisition of BBVA's U.S. banking arm by PNC
- The U.S. Federal Reserve said on Friday it had approved the acquisition of the U.S. operations of Spanish lender BBVA by PNC Financial Services Group Inc, clearing the way for a deal first announced in November.
- 05/14/2021
|
3 Top Bank Stock Picks For 'Goldilocks Inflation' Cycle
- Investors are gearing up for a potential jump in inflation rates following an unprecedented $6 trillion in U.S. government stimulus spending since the beginning of 2020. An extended period of elevated inflation may be great news for banks as long as inflation rates don't get out of control, according to Bank of America analyst Erika Najarian
- 05/11/2021
|
M&As in Banking Sector Jump in April: Will the Trend Continue?
- Bank M&As shot up in April. Banks like Webster (WBS), BancorpSouth (BXS), New York Community (NYCB), Independent Bank (INDB), Guaranty Bancshares (GNTY), PNC Financial (PNC) & BankUnited (BKU) have either announced acquisitions or are planning to do so.
- 05/11/2021
|
Harris Williams Advises Two Sigma Impact and Avance Investment Management on Their Investment in Wholesale Supplies Plus
- RICHMOND, Va.--(BUSINESS WIRE)--Harris Williams, a global investment bank specializing in M&A advisory services, announces it advised Two Sigma Impact and Avance Investment Management (Avance) on their investment in Wholesale Supplies Plus (WSP). WSP is a leading e-commerce provider of ingredients and supplies to commercial artisans who create personal care, beauty and home fragrance products. The transaction was led by Kelly McPhilliamy and Beau Pierce of the Harris Williams Consumer Group
- 05/06/2021
|
Harris Williams Advises Velocity Clinical Research on its Sale to GHO Capital Partners LLP
- RICHMOND, Va.--(BUSINESS WIRE)--Harris Williams, a global investment bank specializing in M&A advisory services, announces it advised Velocity Clinical Research (Velocity), a portfolio company of NaviMed Capital (NaviMed), on its sale to Global Healthcare Opportunities, or GHO Capital Partners LLP (GHO). Velocity is a leading integrated site organization for clinical trials. The transaction was led by Paul Hepper, Nick Owens, Lucas Scholl, Katie Bowden and Jonathan Ferrell of the Harris Wil
- 05/03/2021
|
Harris Williams Advises ADB Companies, LLC on its Sale to Warren Equity Partners
- RICHMOND, Va.--(BUSINESS WIRE)--Harris Williams, a global investment bank specializing in M&A advisory services, announces it advised ADB Companies, LLC and its affiliates (ADB), a leading turnkey provider of telecommunication and utility infrastructure solutions in the United States, on its sale to Warren Equity Partners (Warren Equity). ADB was previously part of the Keeley Companies family of companies. Rusty Keeley, CEO of the Keeley Companies, and Chad Johnson, CEO of ADB, will maintai
- 04/29/2021
|
Harris Williams Advises ACL Airshop as it Partners for Growth With Alinda Capital Partners
- RICHMOND, Va.--(BUSINESS WIRE)--Harris Williams, a global investment bank specializing in M&A advisory services, announces it advised ACL Airshop, a global leader in air cargo unit load device (ULD) logistics solutions to over 200 airlines, air cargo carriers and other transportation clients, on its acquisition by Alinda Capital Partners (Alinda). ACL Airshop is a portfolio company of Argosy Private Equity (Argosy), Balance Point Capital (Balance Point), ORIX Private Equity Solutions, Azale
- 04/27/2021
|
Will There Be Loan Growth in 2021? Not According to This Bank CEO
- This bank is guiding for lower average loan balances in 2021 and is not expecting the type of loan growth other CEOs have been optimistic about.
- 04/27/2021
|
Fundamentals for tech stocks continue to be 'really strong': PNC Financial Services CIO
- PNC Financial Services Chief Investment Officer Amanda Agati joins Yahoo Finance's Emily McCormick and Zack Guzman to break down the latest market action.
- 04/26/2021
|
EVT: A Very Attractive 6.5%-Yielding CEF Trading At A Discount
- EVT: A Very Attractive 6.5%-Yielding CEF Trading At A Discount
- 04/24/2021
|
Bank Stock Roundup: PNC, BK, KEY, CMA & FITB in Focus on Q1 Earnings Beat
- Banks like PNC Financial (PNC), BNY Mellon (BK), KeyCorp (KEY), Comerica (CMA) & Fifth Third (FITB) outpace Q1 estimates on robust fee income growth and reserve releases.
- 04/23/2021
|
Harris Williams Advises Corsearch on Its Sale to Astorg
- LONDON--(BUSINESS WIRE)--Harris Williams, a global investment bank specializing in M&A advisory services, announces the sale of Corsearch, a portfolio company of Audax Private Equity (Audax), to Astorg. Corsearch's innovative brand risk and performance solutions provide an end-to-end brand establishment and brand protection offering to corporations and law firms around the world. The transaction, led by Thierry Monjauze, Julien Oussadon, Mathew Tsui and Luke Clifford of the Harris Williams
- 04/20/2021
|
Grace Capital's Catherine Faddis on finding market opportunity
- Catherine Faddis, Founder and CEO of Grace Capital, joins Worldwide Exchange to discuss her market outlook.
- 04/19/2021
|
Expecting loan growth to return back half of year: PNC CEO on business
- Bill Demchak, PNC CEO, joins 'Closing Bell' to discuss the bank's quarterly earnings, his economic outlook and the overdraft revenue stream banks have.
- 04/16/2021
|
The PNC Financial Services Group, Inc. (PNC) CEO Bill Demchak on Q1 2021 Results - Earnings Call Transcript
- The PNC Financial Services Group, Inc. (PNC) CEO Bill Demchak on Q1 2021 Results - Earnings Call Transcript
- 04/16/2021
|
Retail Banking Earnings Increase For PNC, Report Shows
- PNC Financial Services Group released its first-quarter earnings report Friday (April 16), showing an increase in retail banking along with an overall net income of $1.8 billion. “PNC had a solid start to 2021,” Chairman, President and CEO Bill Demchak said in a statement, pointing to a growth in revenue, improved credit metrics and record […]
- 04/16/2021
|
PNC Financial reports a 3% annualised decline in its first-quarter revenue
- PNC Financial Services Group Inc. (NYSE: PNC) said on Friday that it topped analysts' estimates for earnings and revenue in the fiscal first quarter. PNC Financial shares were reported about 1.5% up in premarket trading on Friday and gained another 1% on market open.
- 04/16/2021
|
PNC Financial (PNC) Q1 Earnings Beat on Decline in Provisions
- PNC Financial's (PNC) Q1 performance highlights strong capital position, higher fee income and lower provisions.
- 04/16/2021
|
The PNC Financial Services Group, Inc (PNC) Surpasses Q1 Earnings and Revenue Estimates
- The PNC Financial Services Group, Inc (PNC) delivered earnings and revenue surprises of 49.09% and 2.24%, respectively, for the quarter ended March 2021. Do the numbers hold clues to what lies ahead for the stock?
- 04/16/2021
|
PNC Financial Services: Q1 Earnings Insights
- Shares of PNC Financial Services Gr (NYSE:PNC) rose 0.1% in pre-market trading after the company reported Q1 results. Quarterly Results Earnings per share increased 110.26% year over year to $4.10, which beat the estimate of $2.75.
- 04/16/2021
|
PNC Reports First Quarter 2021 Net Income Of $1.8 Billion, $4.10 Diluted EPS
- PITTSBURGH, April 16, 2021 /PRNewswire/ -- The PNC Financial Services Group, Inc. (NYSE: PNC) today reported: For the quarter In millions, except per share data and as noted 1Q21 4Q20 1Q20 First Quarter Highlights Financial Results ▪ 5% linked quarter positive operating leverage, driven by modest revenue growth and lower expenses ▪ Significant provision recapture reflecting improved macroeconomic expectations ▪ NIM contracted 5 basis points linked quarter, reflecting the impact of higher balances held at the Federal Reserve ▪ Average loans declined 3% linked quarter primarily due to lower utilization and originations ▪ Average deposits grew 2% on a linked quarter basis – Loan to deposit ratio of 63% ▪ Record capital and liquidity ▪ Improving credit performance; net charge-offs to average loans of 0.25% ▪ BBVA USA acquisition planning on track. Continue to expect a mid-2021 close Revenue $ 4,220 $ 4,208 $ 4,336 Noninterest expense 2,574 2,708 2,543 Pretax, pre-provision earnings (non-GAAP) 1,646 1,500 1,793 Provision for (recapture of) credit losses (551) (254) 914 Net income from continuing operations 1,826 1,456 759 Per Common Share Diluted EPS from continuing operations $ 4.10 $ 3.26 $ 1.59 Book value 118.47 119.11 106.70 Tangible book value (non-GAAP) 96.57 97.43 84.93 Balance Sheet & Credit Quality Average loans (in billions) $ 238.1 $ 245.8 $ 243.6 Average deposits (in billions) 365.4 359.4 289.7 Net loan charge-offs 146 229 212 Allowance for credit losses to total loans 2.20 % 2.46 % 1.66 % Selected Ratios Return on average common equity 14.31 % 11.16 % 7.51 % Return on average assets 1.58 1.24 0.89 Net interest margin (non-GAAP) 2.27 2.32 2.84 Noninterest income to total revenue 44 42 42 Efficiency 61 64 59 Common Equity Tier 1 capital ratio 12.6 12.2 9.4 See non-GAAP financial measures included in the consolidated financial highlights accompanying this news release.
- 04/16/2021
|
Is a Surprise Coming for PNC Financial (PNC) This Earnings Season?
- PNC Financial (PNC) is seeing favorable earnings estimate revision activity and has a positive Zacks Earnings ESP heading into earnings season.
- 04/14/2021
|
Will Fee Income Growth Aid PNC Financial (PNC) Q1 Earnings?
- PNC Financial's (PNC) Q1 earnings are expected to have gained from cost-control efforts and strong equity markets, offset by lower interest rates.
- 04/14/2021
|
5 Red-Hot Big Bank Earnings Charts
- The big banks are no longer market laggards as many have broken out to new 5-year highs.
- 04/13/2021
|
PNC to delay overdraft fees for at least a day with 'virtual wallet' customers
- PNC Financial Services Group Inc. said Tuesday that it will start giving users of its "virtual wallet" offering at least a day to handle overdrafts before the company begins charging fees. The bank will alert customers of negative balances and give them "often more" than a day to address them, which the company said in a release could help customers avoid $125 million to $150 million in overdraft fees each year.
- 04/13/2021
|
PNC CEO on why its changing its overdraft fee policy
- A majority of the Big Banks charge overdraft fees of more than $25, generating more than $11 billion for the banks in 2019 alone, according to the Center for American Lending. PNC announced Monday that it is changing its policy.
- 04/13/2021
|
PNC Launches Low Cash Mode(SM) To Address $17 Billion In Industry Overdraft Fees
- PITTSBURGH, April 13, 2021 /PRNewswire/ -- Addressing the $17 billion that some studies estimate U.S. consumers pay each year in overdraft fees, The PNC Financial Services Group, Inc. (NYSE: PNC) today announced its groundbreaking new Low Cash Mode℠ digital offering that is expected to help Virtual Wallet® customers avoid overdraft fees through unprecedented account transparency and control to manage through low-cash moments or mis-timed payments. "Low Cash Mode gives our customers the ability to avoid unnecessary overdraft fees.
- 04/13/2021
|
7 Bank Stocks to Watch as Q1 Earnings Kick Off
- April marks the beginning of earnings season, and banks have many reasons for optimism. Here are seven bank stocks that have potential upside.
- 04/12/2021
|
The PNC Financial Services Group, Inc (PNC) Earnings Expected to Grow: What to Know Ahead of Next Week's Release
- The PNC Financial Services Group, Inc (PNC) possesses the right combination of the two key ingredients for a likely earnings beat in its upcoming report. Get prepared with the key expectations.
- 04/09/2021
|
Harris Williams Advises DSI Logistics on its Sale to Pilot Freight Services
- RICHMOND, Va.--(BUSINESS WIRE)--Harris Williams, a global investment bank specializing in M&A advisory services, announces it advised DSI Logistics, a portfolio company of Headhaul Capital Partners LLC (Headhaul Capital) and Argosy Private Equity (Argosy), on its sale to Pilot Freight Services (Pilot), a portfolio company of ATL Partners (ATL) and British Columbia Investment Corporation (BCI). DSI Logistics is a premier provider of final-mile delivery services. The transaction was led by Ja
- 04/09/2021
|
Harris Williams Advises AIT Worldwide Logistics on its Recapitalization by The Jordan Company
- RICHMOND, Va.--(BUSINESS WIRE)--Harris Williams, a global investment bank specializing in M&A advisory services, announces it advised AIT Worldwide Logistics (AIT), a portfolio company of Quad-C Management (Quad-C), on its sale to The Jordan Company (TJC) in a recapitalization valued at over $1.2 billion. AIT President and CEO Vaughn Moore and his senior team will continue to lead the business and will remain significant investors in AIT. AIT is a leading non-asset-based global freight forw
- 04/07/2021
|
Mitek Is Protected And Primed By Game Theory, Cheap On An Options Basis
- Mitek Is Protected And Primed By Game Theory, Cheap On An Options Basis
- 04/05/2021
|
Why PNC Financial Services Group Is A Top Socially Responsible Dividend Stock
- PNC Financial Services Group has been named a Top Socially Responsible Dividend Stock by Dividend Channel, signifying a stock with above-average ''DividendRank'' statistics including a strong 2.6% yield
- 04/05/2021
|
PNC Declares Dividend Of $1.15 On Common Stock
- PITTSBURGH, April 1, 2021 /PRNewswire/ -- The board of directors of The PNC Financial Services Group, Inc. (NYSE: PNC) declared a quarterly cash dividend on the common stock of $1.15 per share. The dividend will be payable May 5, 2021, to shareholders of record at the close of business April 16, 2021.
- 04/01/2021
|
Harris Williams Advises Opus 2 on its Pending Sale to Astorg Partners
- LONDON--(BUSINESS WIRE)--Harris Williams, a global investment bank specializing in M&A advisory services, announces it is advising Opus 2, a portfolio company of Five Arrows Principal Investments (FAPI), on its pending acquisition by Astorg Partners (Astorg). Opus 2 is a leading provider of integrated software and services for the global legal disputes market. The transaction is being led by Thierry Monjauze, Julien Oussadon and Mathew Tsui of the Harris Williams Technology Group and John L
- 03/30/2021
|
PNC First Bank To Offer Two Bank On Certified Accounts
- PITTSBURGH, March 30, 2021 /PRNewswire/ -- PNC Bank, N.A. is pleased to announce it is the first bank to offer two products that meet the Cities for Financial Empowerment Fund (CFE Fund)'s Bank On national certification.
- 03/30/2021
|
Is The PNC Financial Services (PNC) a Great Stock for Value Investors?
- Is The PNC Financial Services (PNC) a great pick from the value investor's perspective right now? Read on to know more.
- 03/24/2021
|
Harris Williams Advises Learn on Demand Systems on its Investment from Shamrock Capital
- RICHMOND, Va.--(BUSINESS WIRE)--Harris Williams, a global investment bank specializing in M&A advisory services, announces it advised Learn on Demand Systems on its investment from Shamrock Capital (Shamrock). The transaction was led by Derek Lewis and Bryce Walker of the Harris Williams Business Services Group and Andy Leed of the firm's Technology Group. Learn on Demand Systems is a leading provider of cloud-based virtual lab environments, content, and tools that enable organizations to c
- 03/23/2021
|
PNC Announces Redemption Of 2.150 Percent Senior Bank Notes Due April 29, 2021
- PITTSBURGH, March 19, 2021 /PRNewswire/ -- The PNC Financial Services Group, Inc. (NYSE: PNC) today announced the redemption on March 30, 2021, of all of the outstanding Senior Notes due April 29, 2021, issued by PNC Bank, National Association in the amount of $1,250,000,000 (CUSIP 69353REW4). The securities have a distribution rate of 2.150 percent and an original scheduled maturity date of April 29, 2021.
- 03/19/2021
|
The PNC Financial Services Group Announces First Quarter 2021 Earnings Conference Call and Virtual-Only Annual Shareholders Meeting Details
- PITTSBURGH, March 10, 2021 /PRNewswire/ -- The PNC Financial Services Group, Inc. (NYSE: PNC) expects to issue financial results for the first quarter of 2021, Friday, April 16, as previously announced, at approximately 6:45 a.m. (ET). PNC Chairman, President and Chief Executive Officer William S.
- 03/10/2021
|
Harris Williams Advises GSL Solutions, Inc. on its Sale to BD
- RICHMOND, Va.--(BUSINESS WIRE)--Harris Williams, a global investment bank specializing in M&A advisory services, announces it advised GSL Solutions, Inc. (GSL) on its sale to BD (Becton, Dickinson and Company), a leading global medical technology company. The transaction was led by Andy Dixon, Taylor Will, Michael Mahoney and Naazneen Essabhoy of the Harris Williams Healthcare & Life Sciences (HCLS) Group. “It was a pleasure working with CEO Shelton Louie, COO Joe Intile and the rest of
- 03/04/2021
|
PNC Asset Management Group Names Amanda Agati Chief Investment Officer; Mark McGlone To Retire
- PITTSBURGH, March 3, 2021 /PRNewswire/ -- The PNC Asset Management Group today announced that Amanda Agati will succeed Mark McGlone as chief investment officer (CIO), effective April 9, 2021, upon McGlone's retirement following a 40-year career. "In Amanda, we have a proven leader who...
- 03/03/2021
|
Harris Williams Advises International Sports Sciences Association (ISSA) on its Sale to Tailwind Capital
- RICHMOND, Va.--(BUSINESS WIRE)--Harris Williams, a global investment bank specializing in M&A advisory services, announces it advised International Sports Sciences Association (ISSA), a portfolio company of the BERKS Group, on its sale to Tailwind Capital (Tailwind). ISSA is a pioneer in eLearning and certification for the fitness and wellness community. The transaction was led by Sam Hendler, Andy Leed and Ben de Fiebre of the Harris Williams Technology Group and Zach England and Christoph
- 03/02/2021
|
The value trade is running 'way too far and way too fast' for this stage of the reopening, PNC strategist says
- The major indexes may be kicking off the month in rally mode, but PNC Financial's Amanda Agati sees trouble under the hood.
- 03/01/2021
|
With Small Businesses Permanently Changed By The Pandemic, Owners Looking To Vaccine-Driven Recovery, PNC Survey Shows
- PITTSBURGH, March 1, 2021 /PRNewswire/ -- Small and mid-sized business owners strongly support vaccinations for COVID-19 and plan to encourage their employees to get the shots, which are central to a return to normalcy, according to the latest PNC semi-annual national small business...
- 03/01/2021
|
Harris Williams Advises Chequers Capital on its Acquisition of 7days
- FRANKFURT, Germany--(BUSINESS WIRE)--Harris Williams, a global investment bank specializing in M&A advisory services, announces it advised Chequers Capital on its acquisition of 7days, a portfolio company of Silverfleet Capital (Silverfleet). 7days is a leading direct-to-consumer supplier of fashionable workwear for medical professionals. The transaction was led by professionals from the Harris Williams Consumer Group, including Andreas Poth and Konstantin Molinari of the firm's Frankfurt o
- 02/25/2021
|
Harris Williams Advises Altasciences on its Pending Sale to Novo Holdings A/S
- RICHMOND, Va.--(BUSINESS WIRE)--Harris Williams, a global investment bank specializing in M&A advisory services, announces it is the lead advisor to Altasciences, a portfolio company of Audax Private Equity, on its pending sale to Novo Holdings A/S (Novo Holdings). Founded in 1992, Altasciences is a fully integrated, early drug development services platform, providing the pharma and biotech industries with a trusted partner for drug development, from preclinical safety testing through to cl
- 02/23/2021
|
JPMorgan (JPM) Breaks Out to All-Time High
- JPMorgan (JPM) stock rallied to a new high on Tuesday, fueled by growing financial tailwinds.
- 02/17/2021
|
Regional Bank ETFs Set Multi-Year High as Bond Yields Surge
- Rising bond yields mean more profits for regional banks. Gain exposure to the group with these two industry-themed ETFs.
- 02/17/2021
|
The PNC Financial Services Group, Inc (PNC) Up 0.5% Since Last Earnings Report: Can It Continue?
- The PNC Financial Services Group, Inc (PNC) reported earnings 30 days ago. What's next for the stock?
- 02/15/2021
|
PNC Executives To Speak At Credit Suisse Virtual Conference
- PITTSBURGH, Feb. 10, 2021 /PRNewswire/ -- The PNC Financial Services Group, Inc. (NYSE: PNC) announced today that Chairman, President and Chief Executive Officer William S. Demchak and Executive Vice President and Chief Financial Officer Robert Q. Reilly will discuss business performance,...
- 02/10/2021
|
PNC Strikes Deal To Buy Payment Gateway Firm Tempus Technologies
- PNC Bank N.A. said on Wednesday (Jan. 27) that it has struck a definitive deal to buy payment gateway provider Tempus Technologies, Inc. The purchase is “subject to legal close” and would grow PNC Treasury Management's payment platform, letting business customers handle their receivables and payables via one channel covering all rails, according to an […]
- 01/27/2021
|
Progress On Self-Improvement Efforts Can Make Citi A Winner In 2021
- Progress On Self-Improvement Efforts Can Make Citi A Winner In 2021
- 01/21/2021
|
1 Bank Stock to Buy in 2021
- This bank just made a big acquisition and saw a jump in Q4 earnings.
- 01/21/2021
|
Wells Fargo Continues To Languish Under Its Consent Order
- Wells Fargo Continues To Languish Under Its Consent Order
- 01/20/2021
|
PNC Financial's Valuation Is More Demanding, But Management Has A Good Execution History
- PNC posted a sizable beat due to a bigger reserve release, but core pre-provision profits were basically in line with expectations as higher costs offset higher revenue. Loan growth was a little lackluster and PNC continues to see excess liquidity pressuring results, but loan yields have likely bottomed.
- 01/20/2021
|
A Fintech Expert Has Advice on Valuing IPOs
- Brian Hamilton has launched two big fintech companies called Azlo and One. He shares some advice on how to value and view fintech companies coming onto the public markets.
- 01/20/2021
|
4 Key Themes to Dominate Major U.S. Banking Space in 2021
- After a torrid but resilient 2020, let's see what's in store for major banks like JPMorgan (JPM), Citi (C), BofA (BAC), Wells Fargo (WFC), PNC Financial (PNC), Truist Financial (TFC) & U.S. Bancorp (USB) this year.
- 01/19/2021
|
Today's Stock Market News & Events: 1/19/2021
- Stocks concluded the day on Friday logging both daily losses across the board after President-elect Joe Biden's announcement of a $1.9 trillion rescue plan failed to give investors the sentiment boost they needed.
- 01/19/2021
|
The PNC Financial Services Group, Inc. (PNC) CEO Bill Demchak on Q4 2020 Results - Earnings Call Transcript
- The PNC Financial Services Group, Inc. (PNC) CEO Bill Demchak on Q4 2020 Results - Earnings Call Transcript
- 01/15/2021
|
PNC Financial's revenue slides to £3.10 billion in fiscal Q4
- PNC Financial Services Group Inc. (NYSE: PNC) said on Friday that its profit came in better than last year in the fiscal fourth quarter as it released funds that it had previously set aside for credit losses. The company also expressed confidence that macroeconomic conditions were now showing signs of improvement.
- 01/15/2021
|
9 Bank Stocks That Show No Love for the Cryptocurrency Rally
- Soaring valuations for cryptocurrency assets have sparked much enthusiasm, but these bank stocks will not be receiving much love from speculators. The post 9 Bank Stocks That Show No Love for the Cryptocurrency Rally appeared first on InvestorPlace.
- 01/15/2021
|
PNC Financial (PNC) Q4 Earnings Beat Estimates on Lower Costs
- PNC Financial's (PNC) Q4 performance highlights strong capital position, controlled expenses and lower provisions.
- 01/15/2021
|
PNC Financial Services: Q4 Earnings Insights
- Shares of PNC Financial Services Group (NYSE:PNC) decreased 1.5% in pre-market trading after the company reported Q4 results. Quarterly Results Earnings per share rose 9.76% over the past year to $3.26, which beat the estimate of $2.61.
- 01/15/2021
|
PNC Reports Full Year 2020 Net Income Of $7.6 Billion, $16.96 Diluted EPS
- PITTSBURGH, Jan. 15, 2021 /PRNewswire/ -- The PNC Financial Services Group, Inc. (NYSE: PNC) today reported: For the year For the quarter In millions, except per share data 2020 2019 4Q20 3Q20 4Q19 Net income from continuing operations $3,003 $4,591 $1,456 $1,532 $1,143 Net income from...
- 01/15/2021
|
5 Banks Trading With Low Price-Earnings Ratios
- As of Jan. 14, the GuruFocus All-in-One Screener, a Premium feature, found that the following guru-owned banks have low price-earnings ratios. While some of them are great value investments, others may need to be researched more carefully, according to the discounted cash flow calculator.
- 01/14/2021
|
Preview: PNC Financial Services Gr's Earnings
- On Friday, January 15, PNC Financial Services Gr (NYSE:PNC) will release its latest earnings report. Benzinga's report can help you figure out the ins and outs of the earnings release.
- 01/14/2021
|
Can Q4 Earnings Propel PNC Financial (PNC) Stock to New Highs?
- PNC Financial's (PNC) Q4 earnings are expected to have been gained from cost-control efforts and strong equity markets, offset by lower interest rates.
- 01/14/2021
|
Earnings Season Will Bring Good News for Investors
- The fourth-quarter 2020 earnings season will officially start this coming Friday with a few major banks set to report. Citigroup Inc. (NYSE:C), JPMorgan Chase & Co. (NYSE:JPM), Wells Fargo & Co. (NYSE:WFC) and PNC Financial Services Group Inc. (NYSE:PNC) will all report earnings before the opening bell on Jan. 14, and the expectations have consistently gone up for the financial services industry as the U.S. economy gained steam in the second half of 2020.
- 01/13/2021
|
Can Citigroup, JPMorgan, Wells Fargo Put a Tough Year Behind Them?
- Earnings season for the quarter that ended in December hits the ground running this Friday with quarterly and full-year results from three of the nation's biggest banks and the nation's third-largest regional bank.
- 01/13/2021
|
Why PNC Financial Services (PNC) Might Surprise This Earnings Season
- PNC Financial Services (PNC) is seeing favorable earnings estimate revision activity and has a positive Zacks Earnings ESP heading into earnings season.
- 01/13/2021
|
PNC Hits 3-Year Highs Ahead of Q4 Earnings Report
- The shares of PNC Financial Services Group Inc (NYSE:PNC) are up 1.4% at $161.67 this afternoon, ahead of the banking giant's fourth-quarter earnings report, which is due out before the open on Friday, Jan. 15.
- 01/12/2021
|
Albertsons, Citigroup, JPMorgan, Wells Fargo and More Companies Kicking Off Earnings Season
- The fourth-quarter earnings reporting season is just starting to ramp up, and we will be seeing the first round of major banks results this week.
- 01/10/2021
|
Harris Williams Advises TricorBraun on its Pending Sale to Ares Management Corporation and Ontario Teachers' Pension Plan Board
- RICHMOND, Va.--(BUSINESS WIRE)--Harris Williams, a global investment bank specializing in M&A advisory services, announces it is advising TricorBraun, a portfolio company of AEA Investors LP (AEA), on its pending sale to funds managed by Ares Management Corporation's Private Equity Group (Ares) and Ontario Teachers' Pension Plan Board (Ontario Teachers'). TricorBraun is North America's largest primary packaging distributor and one of the largest providers of packaging in the world. The tran
- 01/07/2021
|
PNC Declares Dividend Of $1.15 On Common Stock
- PITTSBURGH, Jan. 5, 2021 /PRNewswire/ -- The board of directors of The PNC Financial Services Group, Inc. (NYSE: PNC) declared a quarterly cash dividend on the common stock of $1.15 per share. The dividend will be payable Feb. 5, 2021, to shareholders of record at the close of business...
- 01/05/2021
|
Meet 19 Barron's Blessed Dividend Dogs For 2021
- Barron's published 36 unique stock mentions and recommendations for 2021 into recent weekly issues. Barron's staff writers Andrew Bary and Lawrence C Strauss contributed. The 36 Barron's Blessed stocks for 2021 included 19 with dividends representing nine of eleven Morningstar Sectors (no Utilities/Energy). Broker targeted-top-ten net gainers ranged 6.48-29.05% 12/28/21.
- 12/30/2020
|
The Largest Bank Acquisitions in 2020 Had These 4 Things in Common
- The three big regional bank acquisitions of 2020 saw lots of EPS accretion, cost savings, and geographic diversity.
- 12/25/2020
|
PNC Sues Plaid Over Alleged Trademark Infringement
- PNC Financial Services Group has filed a lawsuit against Plaid in Pennsylvania federal court alleging trademark counterfeiting, trademark infringement, false advertising and other wrongdoing for reputedly using PNC's name and logo in Plaid apps. “PNC brings this action because defendant Plaid Inc. has sought to obtain trust and consumer confidence from consumers by intentionally designing user interfaces […]
- 12/23/2020
|
Regional Banks Merge: A Sign Of The Times
- Huntington Bancshares is merging with TCF Financial Corp. to form a bank with $170 billion in assets, moving ahead in order to build scale and develop technological platform.
- 12/15/2020
|
PNC Announces Redemption of 2.500 Percent Senior Bank Notes Due January 22, 2021
- PITTSBURGH, Dec. 11, 2020 /PRNewswire/ -- The PNC Financial Services Group, Inc. (NYSE: PNC) today announced the redemption on Dec. 23, 2020 of all of the outstanding Senior Notes due Jan. 22, 2021 issued by PNC Bank, National Association in the amount of $900,000,000 (CUSIP 69353RFH6)....
- 12/11/2020
|
The PNC Financial Services Group Announces Fourth Quarter And Full Year Earnings Conference Call Details
- PITTSBURGH, Dec. 10, 2020 /PRNewswire/ -- The PNC Financial Services Group, Inc. (NYSE: PNC) expects to issue financial results for the fourth quarter and full year 2020 at approximately 6:45 a.m. (ET), Friday, Jan. 15, 2021, as previously announced. PNC Chairman, President and Chief...
- 12/10/2020
|
Trading Below Its Peers, This Regional Bank Stock Has Upside
- This bank is now trading above tangible book value but is still valued below its peers despite a solid business model and apparently sound credit quality.
- 12/10/2020
|
With Ripple This Hot, Expect Volatility as Well as Opportunity
- Ripple is likely to volatile in the short-run, but increased partnership with global financial institutions should add value to the cryptocurrency in the long-run The post With Ripple This Hot, Expect Volatility as Well as Opportunity appeared first on InvestorPlace. More From InvestorPlace Why Everyone Is Investing in 5G All WRONG Top Stock Picker Reveals His Next 1,000% Winner Radical New Battery Could Dismantle Oil Markets
- 12/09/2020
|
One of Buffett's Favorite Stocks Looks Undervalued
- This stock is currently trading in the middle of its peers, but seemingly outperforming most of them when looking at important metrics.
- 12/09/2020
|
10 Best Bank Stocks To Buy Right Now
- In this article we present the list of 10 best bank stocks to buy right now according to hedge funds. Click to skip ahead and see the top 5 bank stocks to buy today .
- 11/28/2020
|
Guest Fast Pitch: Why you should buy PNC
- Catherine Faddis, Grace Capital CEO, on the reasons to buy PNC. With CNBC's Melissa Lee and the Fast Money traders, Guy Adami, Tim Seymour, Dan Nathan and Brian Kelly.
- 11/24/2020
|
PNC Stock in Focus for Premium Buyers
- The PNC Financial Services Group, Inc. (NYSE:PNC) recently announced an agreement to acquire the U.S. side of BBVA's business.
- 11/20/2020
|
BBVA USA Is a Bad Bank. How Will It Help PNC?
- By most metrics investors use to evaluate bank stocks, BBVA USA is not a great franchise. Yet it offers PNC several pieces the regional lender has been looking for.
- 11/20/2020
|
PNC Promotes Senior Technology Executives Deborah Guild And Ganesh Krishnan
- PITTSBURGH, Nov. 19, 2020 /PRNewswire/ -- The PNC Financial Services Group, Inc. (NYSE: PNC) today announced that it has expanded the leadership roles of Chief Security Officer Deborah Guild and Corporate & Institutional Bank (C&IB) and Staff Service Technology Chief Information Officer...
- 11/19/2020
|
After PNC's BBVA deal, Oppenheimer analyst says regional bank breakout is bullish for entire market
- Regional banks spiked on Monday after PNC announced it would buy the U.S. unit of BBVA. Here's why the move is a plus for the market.
- 11/17/2020
|
Spain's BBVA goes shopping for smaller rival just hours after selling its U.S. operations to PNC
- European banks are under pressure to consolidate to cope with ultralow interest rates.
- 11/17/2020
|
Berkshire Hathaway reduces its stake in major banks, JP Morgan, PNC, M&T
- Leslie Picker joins 'Closing Bell' to report Berkshire Hathaway is reducing its stake in major banks.
- 11/16/2020
|
PNC to buy BBVA's US operations for $11.6 billion
- Yahoo Finance's Brian Cheung reports the latest news of PNC bank's plans to buy BBVA's US operations. #PNC #PNCBBVA #YahooFinance Subscribe to Yahoo Finance: https://yhoo.it/2fGu5Bb About Yahoo Finance: At Yahoo Finance, you get free stock quotes, up-to-date news, portfolio management resources, international market data, social interaction and mortgage rates that help you manage your financial life.
- 11/16/2020
|
PNC Acquiring U.S. Operations Of BBVA For $11.6 Billion
- PNC Financial Services Group Inc (NYSE: PNC) is acquiring the U.S. operations of Spanish financial group Banco Bilbao Vizcaya Argentaria SA (NYSE: BBVA). These are the details.
- 11/16/2020
|
PNC Financial CEO Bill Demchak on the deal to buy BBVA's U.S. operations
- William Demchak, chairman and CEO of PNC Financial, joins "Squawk on the Street" to discuss the company's $11.6 billion deal to buy BBVA's U.S. operations.
- 11/16/2020
|
PNC to buy Spanish bank BBVA's US business for $11.6 billion
- American bank PNC has reached a deal to buy Spanish finance giant BBVA's US business for $11.6 billion, the companies announced Monday. The cash acquisition will expand Pittsburgh-based PNC's retail presence while pulling BBVA out of the US altogether in the second-largest US banking deal since the 2008 financial crisis that sparked the Great Recession.
- 11/16/2020
|
PNC to Acquire U.S. Division of Spanish Bank, Creating Fifth Largest American Bank
- PNC will purchase the U.S. arm of BBVA in an all-cash deal valued at $11.6 billion. The purchase will add $100 billion in assets and create a national presence.
- 11/16/2020
|
Did PNC Pay Too Much for BBVA's US Business?
- Regional banking leader PNC Financial Group Inc. (NYSE: PNC) is extending its reach beyond its strongholds along the Atlantic Coast and in the Southeast and Midwest.
- 11/16/2020
|
PNC Financial Agrees to Purchse BBVA USA
- Nov.16 -- PNC Financial Services Group Inc. agreed to buy Banco Bilbao Vizcaya Argentaria SA's banking operations in the U.S. for $11.6 billion in a deal that would make it the nation's largest regional bank. Bloomberg's Jan-Henrik Foerster reports on “Bloomberg Markets: European Open.
- 11/16/2020
|
PNC is buying US business of Spain's BBVA for $11.6 billion
- PNC is spending billions to cement its place among America's largest banks.
- 11/16/2020
|
PNC Eyes Spanish Bank BBVA's US Unit In $11B Deal: WSJ
- PNC Financial Services Group Inc (NYSE: PNC) is in advanced discussions to absorb Spanish bank Banco Bilbao Vizcaya Argentaria SA's (NYSE: BBVA) U.S. business in an all-cash deal, according to the Wall Street Journal. What Happened: BBVA USA's operations hold approximately $100 billion in assets and the sale could raise proceeds of over $11 billion for the bank, the Journal noted.
- 11/16/2020
|
PNC to buy U.S. operations of Spanish bank BBVA for $11.6 billion
- Spanish financial group BBVA has agreed to sell its U.S. business, BBVA USA Bancshares, to PNC Financial Services Group for $11.6 billion, the American firm announced Monday.
- 11/16/2020
|
PNC to buy BBVA's U.S. banking arm for $11.6 billion in cash
- PNC Financial Services Group Inc said on Monday it would buy the U.S. business of Spanish lender BBVA for $11.6 billion in cash, further consolidating the U.S. banking sector.
- 11/16/2020
|
PNC Announces Agreement To Buy BBVA USA Bancshares, Inc.
- PITTSBURGH, Nov. 16, 2020 /PRNewswire/ -- The PNC Financial Services Group, Inc. (NYSE: PNC) and the Spanish financial group, Banco Bilbao Vizcaya Argentaria, S.A. (NYSE and MAD: BBVA) today announced that they have signed a definitive agreement for PNC to acquire BBVA USA Bancshares, Inc....
- 11/16/2020
|
PNC Eyes Buying US Unit Of Spain's BBVA, Report Says
- PNC Financial Services Group could buy the U.S. arm of Spain-based BBVA for over $11 billion, which could be one of the largest bank acquisitions since the financial crisis over a decade ago, The Wall Street Journal (WSJ) reported, with the deal potentially announced as soon as Monday (Nov. 16). The deal, the report stated, […]
- 11/15/2020
|
Lender PNC Financial in talks to buy BBVA's U.S. arm: WSJ
- PNC Financial Services Group Inc is in talks to buy the U.S. arm of Spanish bank BBVA in what could be one of the largest bank tie-ups since the financial crisis, the Wall Street Journal reported https://on.wsj.com/38YxxWH on Sunday.
- 11/15/2020
|
Despite Improving Market Conditions, PNC's CEO Has Not Changed His Approach to M&A
- Bill Demchak seems to be following the same acquisition strategy as six months ago.
- 11/15/2020
|
Why Regional Bank Stocks Will Benefit More From a COVID-19 Vaccine
- All banks are anticipating loan losses due to the pandemic, but the regional players appear more exposed to those risks than both their larger and smaller peers.
- 11/13/2020
|
BofA Securities Raises Price Targets on Top Bank Dividend Stocks to Buy
- When the market blew up during the great financial crisis of 2007–2009, the banks and brokerage stocks were ostensibly part of the reason for the collapse as they had aided and abetted the mortgage crisis.
- 11/12/2020
|
Why a Second Stimulus Is So Important for Bank Stocks
- Many think a second round of stimulus could play a big role in how loan losses develop in the banking sector.
- 11/11/2020
|
Credit Card Trends at Banks Are Much Improved, but Can It Last?
- Credit card deferrals, charge-offs, and loans 90 days past due are all down from earlier this year or on a year-over-year basis. But will they continue to stay that way?
- 11/09/2020
|
Bank M&A: The Buyers Are Ready, but Now They're Waiting on the Sellers
- Bank CEOs seem ready to start looking at mergers and acquisitions, but the sellers may still want to wait until the economic outlook improves.
- 11/04/2020
|
Hedge Funds Have Never Been This Bullish On The PNC Financial Services Group Inc. (PNC)
- Keeping this in mind, let's analyze whether The PNC Financial Services Group Inc. (NYSE:PNC) is a good investment right now by following the lead of some of the best investors in the world and piggybacking their ideas. There's no better way to get these firms' immense resources and analytical capabilities working for us than to follow their lead into their best ideas. While not all of these picks will be winners, our research shows that these picks historically outperformed the market when we factor in known risk factors.
- 10/26/2020
|
This CEO Just Said a Second Round of Stimulus 'Absolutely' Needs to Happen
- The CEO believes consumer and commercial loan losses could ultimately be tied to how much more stimulus Congress provides.
- 10/19/2020
|
PNC Financial's Long-Term Qualities Seem Less Than Fully Appreciated
- PNC Financial's Long-Term Qualities Seem Less Than Fully Appreciated
- 10/16/2020
|
The PNC Financial Services Group, Inc. (PNC) CEO William Demchak on Q3 2020 Results - Earnings Call Transcript
- The PNC Financial Services Group, Inc. (PNC) CEO William Demchak on Q3 2020 Results - Earnings Call Transcript
- 10/14/2020
|
PNC Financial (PNC) Q3 Earnings Beat, Provisions Decline
- PNC Financial's (PNC) Q3 performance highlights fee income growth, controlled expenses and lower provisions.
- 10/14/2020
|
Recap: PNC Financial Services Q3 Earnings
- Shares of PNC Financial Services Group (NYSE:PNC) rose 1.3% in pre-market trading after the company reported Q3 results. Quarterly Results Earnings per share rose 15.31% over the past year to $3.39, which beat the estimate of $2.12.
- 10/14/2020
|
Whalen Global Advisors Chairman on bank earnings and opportunities in the space
- Chris Whalen, Chairman of Whalen Global Advisors, joins Worldwide Exchange to discuss the week ahead for banks' quarterly results, and the names he's looking at in the financials sector.
- 10/14/2020
|
PNC Reports Third Quarter 2020 Net Income Of $1.5 Billion, $3.39 Diluted EPS
- PITTSBURGH, Oct. 14, 2020 /PRNewswire/ -- The PNC Financial Services Group, Inc. (NYSE: PNC) today reported: For the quarter In millions, except per share data 3Q20 2Q20 3Q19 Net income (loss) from continuing operations $1,532 ($744) $1,181 Net income from discontinued operations — $4,399...
- 10/14/2020
|
Earnings Preview: PNC Financial Services Gr
- On Wednesday, October 14, PNC Financial Services Gr (NYSE: PNC) will report its last quarter's earnings. Here is Benzinga's preview of the company's release.
- 10/13/2020
|
Crises in 2020 Are Accelerating Change at Biggest Banks
- How the 2020 pandemic, social awakening, and climate change crisis are accelerating change and challenging America's biggest banks.
- 10/13/2020
|
Lower Interest Income to Mar PNC Financial (PNC) Q3 Earnings
- PNC Financial's (PNC) cost-control efforts and benefits from strong equity markets are likely to have been offset by lower interest rates in the third quarter.
- 10/12/2020
|
4 Large Cap Dividend Payers on My Watchlist
- One way to take advantage of market volatility is to maintain a watchlist of stocks that you want to buy. I maintain a watchlist of stocks I own and those I'd consider buying at the right price.
- 10/11/2020
|
Are Banks Reserving Enough for Commercial Real Estate Default Risk?
- Office, retail, and hotels have been hit hard by the pandemic, so it's good to understand the exposure some of the large commercial real estate lenders have in these sectors.
- 10/09/2020
|
PNC Financial Declares Dividend, Stock Rises in Past Week
- The bank maintains one of the highest dividend payouts in the sector
- 10/01/2020
|
PNC Appoints New Member to Board of Directors
- PITTSBURGH, Oct. 1, 2020 /PRNewswire/ -- The PNC Financial Services Group, Inc. (NYSE: PNC) today appointed David L. Cohen to its Board of Directors, effective immediately. Cohen is a senior executive vice president of Comcast Corporation, where he has held leadership roles covering a...
- 10/01/2020
|
PNC Announces Redemption Of 2.450 Percent Senior Bank Notes Due November 5, 2020
- PITTSBURGH, Sept. 25, 2020 /PRNewswire/ -- The PNC Financial Services Group, Inc. (NYSE: PNC) today announced the redemption on Oct. 6, 2020, of all of the outstanding Senior Notes due Nov. 5, 2020, issued by PNC Bank, National Association in the amount of $1,500,000,000 (CUSIP 69353REU8)....
- 09/25/2020
|
Top Financial Stocks for October 2020
- These are the financial stocks with the best value, fastest growth, and most momentum for October 2020.
- 09/24/2020
|
PNC Financial, KeyCorp Accelerate Branch Closures Amid Crisis
- PNC Financial (PNC) and KeyCorp (KEY) announce plans of closing more branches through 2021 to cope with the aftershocks of the pandemic.
- 09/17/2020
|
Banks Down on Bleak Revenue Outlook as Loan Demand Falters
- Near zero interest rates and mute demand for loans are likely to hamper banks' revenue growth, going forward.
- 09/16/2020
|
Banks lower revenue outlook as pandemic crimps loan demand
- Executives at the top U.S. banks warned investors this week that 2020 revenue will be lower than expected due to weak loan demand and an uptick in repayments during the coronavirus pandemic.
- 09/15/2020
|
Warren Buffett In September: 44 Equities Yield 7 Buy-And-Hold Dividend Picks
- Warren Buffett In September: 44 Equities Yield 7 Buy-And-Hold Dividend Picks
- 09/13/2020
|
The PNC Financial Services Group Announces Third Quarter Earnings Conference Call Details
- PITTSBURGH, Sept. 11, 2020 /PRNewswire/ -- The PNC Financial Services Group, Inc.
- 09/11/2020
|
Rising Costs to Hurt PNC Financial's Profits: Time to Sell?
- Persistently rising expenses and lack of loans diversification remain major concerns for PNC Financial (PNC) in the near term.
- 09/09/2020
|
PNC Bank Celebrates 10th Annual Women In Business Week
- PITTSBURGH, Sept. 2, 2020 /PRNewswire/ -- To connect with and better support its female customers and other female financial decision makers, PNC Bank hosts an annual Women in Business Week.
- 09/02/2020
|
PNC Chief Executive To Speak At Barclays Global Financial Services Virtual Conference
- PITTSBURGH, Sept. 1, 2020 /PRNewswire/ -- The PNC Financial Services Group, Inc.
- 09/01/2020
|
Is Warren Buffett Giving Up On Bank Stocks?
- The Oracle of Omaha sold shares of several banks in the second quarter.
- 08/21/2020
|
3 Unknown (but Amazing) Dividend Stocks
- You really should get to know these great dividend stocks.
- 08/20/2020
|
Buffett Didn't Buy Banks in Q2
- Even though Berkshire Hathaway made a big move on Bank of America in July, the company was quiet in the second quarter, according to its just-released 13F.
- 08/14/2020
|
Soros loads up on banks, cloud-based software companies
- Billionaire George Soros showed interest in big banks and cloud-computing companies in the second quarter, according to a filing with the Securities and Exchange Commission.
- 08/14/2020
|
Berkshire Hathaway 13F filing reveals 27 percent reduction in Wells Fargo
- CNBC's Dominic Chu joins "Closing Bell" to discuss financials in the Berkshire Hathaway 13f filing.
- 08/14/2020
|
4 Banks That Did a Poor Job of Forecasting Loan-Loss Projections
- Each of these banks saw huge increases in its quarterly loan-loss provisions between the first and second quarters of the year.
- 08/01/2020
|
PNC Announces Redemption Of All Depositary Shares Representing Interests In Series Q Stock
- PITTSBURGH, July 31, 2020 /PRNewswire/ -- The PNC Financial Services Group, Inc. (NYSE: PNC) today announced the redemption on Sept.
- 07/31/2020
|
7 Bank Stocks That Are Struggling to Escape Precarious Situations
- Even if you're bullish on banks, you should steer clear of these sev
- 07/27/2020
|
PNC Bank Celebrates The Spirit Of Entrepreneurship And Women Who Achieve
- PITTSBURGH, July 22, 2020 /PRNewswire/ -- PNC Bank will host a free educational webcast for business owners and executives from 12 – 1 pm ET Thursday, July 23, 2020, with Angie Bastian, co-founder of Angie's BOOMCHICKAPOP. This webcast supports PNC's ongoing commitment to help.
- 07/22/2020
|
Why PNC May Use a Different M&A Playbook Than It Did During the Great Recession
- The bank pounced on a big acquisition in 2008 during the Great Recession, but now it may be more patient.
- 07/19/2020
|
PNC Financial: Credit Costs Appear To Have Peaked
- Target price for June 2021 suggests a high upside from the current market price, which justifies a bullish rating.
- 07/18/2020
|
PNC's Core Banking Ops Are Under Pressure, But M&A Optionality Is A Plus
- PNC's Core Banking Ops Are Under Pressure, But M&A Optionality Is A Plus
- 07/16/2020
|
PNC Financial: A Case For Buying A Bank In The Middle Of A Recession
- Management has been vocal about their desire to use the $14 Billion BLK sale proceeds to fund M&A activity via another midsize bank.
- 07/15/2020
|
The PNC Financial Services Group, Inc. (PNC) CEO William Demchak on Q2 2020 Results - Earnings Call Transcript
- The PNC Financial Services Group, Inc. (PNC) CEO William Demchak on Q2 2020 Results - Earnings Call Transcript
- 07/15/2020
|
PNC Financial prints an over 100% increase in profit in the fiscal second quarter
- PNC Financial Services Group Inc. (NYSE: PNC) revealed an over 100% increase in its profit in the second quarter on Wednesday.
- 07/15/2020
|
Sale of BlackRock Boosts PNC to Profitable Quarter
- The bank managed to generate $3.7 billion in profits, although in terms of operating net income, it would have reported a loss.
- 07/15/2020
|
PNC Financial (PNC) Reports Q2 Loss, Provisions Escalate
- PNC Financial's (PNC) Q2 performance highlights lower revenues, controlled expenses and elevated provisions.
- 07/15/2020
|
PNC Financial: Q2 Earnings Insights
- Shares of PNC Financial Services Group (NYSE:PNC) rose 1.8% in pre-market trading after the company reported Q2 results.
- 07/15/2020
|
PNC Financial's profit more than doubles on gain sale of stake in BlackRock
- PNC Financial's second-quarter profit more than doubled as the U.S. regional bank recorded a gain from the sale of its position in asset manager BlackRock.
- 07/15/2020
|
PNC Reports Second Quarter 2020 Net Income Of $3.7 Billion, $8.40 Diluted EPS, Reflecting Gain On BlackRock Sale
- PITTSBURGH, July 15, 2020 /PRNewswire/ -- The PNC Financial Services Group, Inc. (NYSE: PNC) today reported: For the quarter 2Q20 1Q20 2Q19 Net income (loss) from continuing operations ($744) $759 $1,185 Net income from discontinued operations $4,399 $156 $189 Net income $ millions $3,655...
- 07/15/2020
|
Look for Acquisition Targets as Bank M&A Activity Picks Up
- While there may not be a ton of banks fetching a premium right now, bank M&A can still create value.
- 07/15/2020
|
Is PNC Financial Services a Buy?
- It may not be a home run, but PNC should be a hit for investors.
- 07/14/2020
|
What's in the Cards for PNC Financial (PNC) in Q2 Earnings?
- PNC Financial's (PNC) cost-control efforts and benefits from strong equity markets are likely to have been offset by lower interest rates in the second quarter.
- 07/13/2020
|
Why These 'Top 10' Bank Stocks Have Fallen More Than 30% in 2020
- Even top banks found themselves on the bottom during the first half of the year.
- 07/10/2020
|
7 Bank Stock Dividends That Still Look Safe Heading Into 2021
- When the Federal Reserve last week published the results of its latest stress tests on 34 U.S.
- 07/02/2020
|
Which Major Banks Will Maintain Their Dividends?
- Some are still undecided about whether to hold their payouts steady or cut them next quarter.
- 06/30/2020
|
PNC Announces Stress Capital Buffer; Declares Dividend Of $1.15 On Common Stock
- PITTSBURGH, June 30, 2020 /PRNewswire/ -- The PNC Financial Services Group, Inc. (NYSE: PNC) last week received the results of the Federal Reserve's 2020 Comprehensive Capital Analysis and Review (CCAR). The Federal Reserve's CCAR disclosure included its estimate of PNC's minimum capital...
- 06/30/2020
|
PNC Releases Results Of Annual Dodd-Frank Company-Run Stress Test
- PITTSBURGH, June 25, 2020 /PRNewswire/ -- The PNC Financial Services Group, Inc. (NYSE: PNC) announced today the results of its biennial company-run stress test conducted in accordance with regulations of the Board of Governors of the Federal Reserve System (Federal Reserve) and the...
- 06/25/2020
|
Get Paid While You Wait: 3 Top Dividend Stocks in the Financial Sector
- One of these companies raised its dividend 18% this year.
- 06/25/2020
|
3 Stocks Warren Buffett Probably Bought in Q2
- If the Oracle of Omaha put Berkshire Hathaway's $137 billion cash hoard to work in the second quarter, it was likely on these three stocks.
- 06/25/2020
|
Which Bank Will Eastern Bank Look to Buy After its IPO?
- The bank said it would like to use its new capital to pursue acquisitions. This could mean a huge deal that could transform the Boston banking scene.
- 06/25/2020
|
PNC Commits More Than $1 Billion To Help End Systemic Racism And Support Economic Empowerment Of African Americans And Low- And Moderate-Income Communities
- PITTSBURGH, June 18, 2020 /PRNewswire/ -- The PNC Financial Services Group, Inc. (NYSE: PNC) today announced a commitment of more than $1 billion to help end systemic racism and support economic empowerment of African Americans and low- and moderate-income communities. "We are living in...
- 06/18/2020
|
PNC To Close Early In Observance Of Juneteenth
- PITTSBURGH, June 17, 2020 /PRNewswire/ -- The PNC Financial Services Group, Inc. (NYSE: PNC) today announced that it will close all offices at 2 p.m., local time, Friday, June 19, in observance of Juneteenth. "If there is anything the past few weeks in our country have revealed, it's that...
- 06/17/2020
|
JPMorgan, Wells Fargo and Others Under Probe for PPP Procedure
- Major banks have been asked to submit documents, regarding applications received, and all communications with SBA and Treasury on which application to prioritize.
- 06/17/2020
|
PNC Announces Redemption Of 2.600 Percent Senior Bank Notes Due July 21, 2020
- PITTSBURGH, June 11, 2020 /PRNewswire/ -- The PNC Financial Services Group, Inc. (NYSE: PNC) today announced the redemption on June 22, 2020 of all of the outstanding Senior Notes due July 21, 2020 issued by PNC Bank, National Association in the amount of $750,000,000 (CUSIP 69353RES3)....
- 06/11/2020
|
Is PNC Financial Services Group a Buy?
- The bank has solid fundamentals, lots of liquidity, and a chance to further separate itself from the regional banking cluster.
- 06/05/2020
|
The PNC Financial Services Group Provides Quarterly Earnings Release Dates For 2021
- PITTSBURGH, June 3, 2020 /PRNewswire/ -- The PNC Financial Services Group, Inc. (NYSE: PNC) announced today that it expects to issue quarterly earnings releases pre-market open and hold conference calls at the times indicated on the following dates: Fourth Quarter 2020 – Friday, Jan. 15,...
- 06/03/2020
|
Deep Dive: These 16 stocks figured prominently in this $39 billion-fund manager’s strategy as markets dove in March
- Amid a weeks-long rally in stocks, some investors may already have forgotten how painful it was when the market crashed in late February and March.
- 06/03/2020
|
5 Regional Banks That Could Make an Acquisition
- These banks are all trading at higher price-to-tangible-book-values than their peers.
- 06/02/2020
|
3 Dirt-Cheap Stocks Billionaires Are Buying
- Some of the most successful investors in the world have loaded up on these three beaten-down stocks recently.
- 05/31/2020
|
Is it safe to trim Apple for some profit? and more #AskHalftime
- The "Halftime Report" traders answer viewer questions in #AskHalftime.
- 05/29/2020
|
PNC Announces Redemption Of Senior Floating Rate Bank Notes Due June 10, 2021
- PITTSBURGH, May 29, 2020 /PRNewswire/ -- The PNC Financial Services Group, Inc. (NYSE: PNC) today announced the redemption on June 10, 2020 of all of the outstanding Senior Floating Rate Notes due June 10, 2021 issued by PNC Bank, National Association in the amount of $800,000,000 (CUSIP...
- 05/29/2020
|
PNC Chief Executive To Speak At Morgan Stanley Virtual Investor Conference
- PITTSBURGH, May 26, 2020 /PRNewswire/ -- The PNC Financial Services Group, Inc. (NYSE: PNC) announced today that Chairman, President and Chief Executive Officer William S. Demchak will discuss business performance, strategy and banking in a moderated discussion format at 10:15 a.m. (ET)...
- 05/26/2020
|
6 Banks PNC Might Want to Buy
- PNC recently came into a large amount of cash after selling its entire stake in BlackRock, making it clear that it is looking to make a big deal.
- 05/22/2020
|
3 Stocks the World's Best Investors Just Bought
- Want to invest like Buffett or Einhorn? Check out what they're buying.
- 05/22/2020
|
The 4 Stocks Warren Buffett Was Buying in Q1
- Interestingly, two of the four stocks purchased are no longer in Berkshire Hathaway's investment portfolio.
- 05/20/2020
|
Warren Buffett, Top Funds Dumped These Stocks But Key Buys Stand Out
- Berkshire Hathaway cut its stake in Amazon and Goldman Sachs, but Warren Buffett maintained Apple in Q1. Hedge funds bought Walt Disney and GE.
- 05/18/2020
|
PNC Financial (PNC) Concludes Sale of BlackRock Ownership
- PNC Financial's (PNC) sale of ownership in BlackRock boosts its liquidity to explore attractive investment opportunities.
- 05/18/2020
|
8 Banks In Bear Market Territory: Year-To-Date Scorecard
- Here's a look at how some of the big banks are doing this year.
- 05/17/2020
|
This Dirt-Cheap Stock Still Looks Likes Warren Buffett's Favorite Buy in 2020
- For the second quarter in a row, this was the Oracle of Omaha's biggest stock purchase.
- 05/17/2020
|
3 Big Revelations from Warren Buffett's Latest Investing Moves
- Berkshire Hathaway's quarterly portfolio holdings provide some interesting color, even though we already knew about some of its CEO's subsequent decisions.
- 05/16/2020
|
Warren Buffett Buys No New Stocks in 1st Quarter, but Expands PNC Financial Stake
- Berkshire invested in 526,930 shares of PNC Financial, bringing its total stake up to nearly 9.2 million shares.
- 05/15/2020
|
PNC Announces Closing of Sale of BlackRock Stock
- PITTSBURGH, May 15, 2020 /PRNewswire/ -- The PNC Financial Services Group, Inc. (NYSE:PNC) today announced the closing of its sale of 31.6 million shares of BlackRock, Inc. (NYSE:BLK) common and preferred stock through a registered offering at a price of $420 per share. This includes the...
- 05/15/2020
|
RBC's Gerard Cassidy weighs in on financials rally
- Wells Fargo pops on rumors of a Goldman Sachs takeover. With CNBC's Melissa Lee and the Fast Money traders, Tim Seymour, Guy Adami, Steve Grasso and Karen Finerman.
- 05/14/2020
|
Watch CNBC's full interview with PNC CEO William Demchak
- William Demchak, PNC Chairman and CEO, joins 'Closing Bell' to discuss if he sees there is value in the market, why the company sold its stake in BlackRock and the future of banks.
- 05/14/2020
|
PNC Financial CEO on how they're using cash from selling BlackRock stake
- William Demchak, PNC Chairman and CEO, joins 'Closing Bell' to discuss whether he sees value in the market, why the company sold its stake in BlackRock and the future of banks.
- 05/14/2020
|
Are the Bank Stocks Deals?
- Bank stocks have sunk due to coronavirus impacts. Should value investors be taking a look?
- 05/14/2020
|
PNC Financial Ratings Affirmed by Moody's, Outlook Stable
- Moody's Investors Service affirms ratings and assessments of PNC Financial (PNC) and its bank subsidiary. Further, the rating firm's outlook for the bank has been maintained at "stable".
- 05/14/2020
|
Why PNC Is Selling Its Stake in BlackRock
- Many say the bank could be looking to make a big acquisition, similar to one it made in 2008.
- 05/13/2020
|
PNC Financial Locks In Margin Of Safety With BlackRock Sale
- PNC Financial Locks In Margin Of Safety With BlackRock Sale
- 05/13/2020
|
PNC Sells Its Roughly $17 Billion Stake in BlackRock
- The giant asset manager will buy back some of those shares.
- 05/12/2020
|
PNC Financial (PNC) to Divest 22.4% Ownership in BlackRock
- PNC Financial's (PNC) divesture of interest in BlackRock will strengthen its balance sheet position.
- 05/12/2020
|
BlackRock Largest Shareholder To Sell Entire Stake After Making 70-Fold Gains
- PNC Financial Services Group Inc. (NYSE: PNC) on Monday announced that it is exiting its investment in asset management firm BlackRock Inc.
- 05/12/2020
|
5 Stocks Buffett Probably Bought in the First Quarter
- Berkshire Hathaway acquired $4 billion in equities during Q1, and these are the companies that were likely purchased.
- 05/12/2020
|
PNC Unlocks Value and Bolsters Capital With Mega BlackRock Stake Sale
- The PNC Financial Services Group, Inc. (NYSE: PNC) is about to bolster its capital to the highest levels in the company’s history.
- 05/11/2020
|
Regional Bank Stocks Rally From Chart Support
- Underperforming regional banks helped lead stocks higher Friday. Here's why the rally may continue.
- 05/11/2020
|
PNC Earnings Decrease On COVID Provisions -- Fee Income Declines as Well
- Fee income can't offset expected credit losses.
- 04/22/2020
|
PNC Financial Beats Estimates, Remains Under Pressure
- The major regional bank beat expectations in five consecutive quarters, but shares remain under pressure due to pandemic-related defaults.
- 04/20/2020
|
PNC Financial Services Sees Q1 Profits Decline 28%
- The bank took a credit provision nearly five times higher than in the first quarter of 2019 to prepare for expected losses.
- 04/17/2020
|
PNC Financial Getting Ready For Higher Loan Losses
- PNC Financial Getting Ready For Higher Loan Losses
- 04/16/2020
|
The PNC Financial Services Group, Inc. (PNC) CEO William Demchak on Q1 2020 Results - Earnings Call Transcript
- The PNC Financial Services Group, Inc. (PNC) CEO William Demchak on Q1 2020 Results - Earnings Call Transcript
- 04/15/2020
|
PNC Financial (PNC) Q1 Earnings Top, Provisions Up on Coronavirus
- PNC Financial's (PNC) Q1 performance highlights top-line strength and controlled expenses, partly offset by elevated provisions.
- 04/15/2020
|
Recap: PNC Financial Q1 Earnings
- Shares of PNC Financial Services Gr (NYSE: PNC) were unchanged in pre-market trading after the company reported upbeat Q1 results.
- 04/15/2020
|
Will Lower Rates Impact PNC Financial's (PNC) Q1 Earnings?
- Lower rates followed by the coronavirus outbreak and a disappointing fee income are likely to have dampened PNC Financial's (PNC) performance in the January-March quarter.
- 04/14/2020
|
Bank Stocks at Record Lows Relative to S&P 500: 4 to Buy Now
- When the market blew up during the global financial crisis of 2007 to 2009, the banks and brokerage stocks were ostensibly part of the reason for the collapse, as they had aided and abetted the mortgage crisis.
- 04/08/2020
|
Bank Dividends and Book Values to Come Under Deep Scrutiny With Earnings
- The start of 2020 felt like a virtual Goldilocks period for the major U.S. banks, but the COVID-19 recession has changed all of that drastically.
- 04/06/2020
|
PNC Financial (PNC) Displays Organic Growth: Time to Hold?
- PNC Financial (PNC) appears to be a promising buying opportunity now, based on its rising loan and deposit balances aiding top-line growth.
- 04/03/2020
|
What Are Small Banks Doing With Stock Buybacks?
- Find out which are keeping repurchases in place and which are cutting back.
- 03/29/2020
|
Regulators to Ease Big Bank Rules Amid Coronavirus Mayhem?
- Regulators are likely to ease out rules for banks to support risky lending but with requirements of conserving capital for severe economic uncertainty.
- 03/19/2020
|
Banks Crash as Spiraling Coronavirus Fears Spook Investors
- Financial sector tumbles on investors' concerns over banks' earnings outlooks, following the measures declared to counter the coronavirus pandemic.
- 03/17/2020
|
Why Regional Bank Stocks Could Outperform Larger Banks in 2020
- Regional banks are looking at potentially better margins and enhanced regulatory relief.
- 03/11/2020
|
3 Bank Stocks to Buy Contrarians Should Consider
- PNC, JPM and MS are all bank stocks to buy amid economic chaos and coronavirus concerns.
- 03/09/2020
|
Notable Insider Buys Last Week: Newell Brands, PNC Financial And More
- Insider buying can be an encouraging signal for potential investors. Some insiders took advantage of volatility to purchase shares.
- 03/08/2020
|
Daily Insider Ratings Round Up 1/22/20
- Expect insider filing volumes to increase again in the first week of February and stay strong through the end of March.
- 01/25/2020
|
Why The PNC Financial Services Group, Inc (PNC) is a Top Dividend Stock for Your Portfolio
- Dividends are one of the best benefits to being a shareholder, but finding a great dividend stock is no easy task. Does The PNC Financial Services Group, Inc (PNC) have what it takes?
- 01/16/2020
|
4 Financial Services Stocks Flying High on Solid Q4 Earnings
- Financial Services companies flourished despite a low-rate environment and remarkably outperformed analysts' estimates in fourth-quarter 2019.
- 01/16/2020
|
PNC Financial Earnings: PNC Stock Slips 4% Despite Q4 Beat
- PNC Financial (PNC) earnings for the American banking company's fourth quarter of 2019 have PNC stock down Wednesday despite a beat.
The post PNC Financial Earnings: PNC Stock Slips 4% Despite Q4 Beat appeared first on InvestorPlace.
- 01/15/2020
|
PNC Financial Services Group, Inc. (PNC) CEO William Demchak on Q4 2019 Results - Earnings Call Transcript
- PNC Financial Services Group, Inc. (PNC) CEO William Demchak on Q4 2019 Results - Earnings Call Transcript
- 01/15/2020
|
PNC Financial (PNC) Q4 Earnings Top Estimates, Costs Flare Up
- PNC Financial's (PNC) Q4 performance highlights top-line strength, partly offset by elevated expenses and provisions.
- 01/15/2020
|
PNC Financial quarterly profit beats on higher loan growth
- PNC Financial Services Group Inc on Wednesday posted a better-than-expected fourth-quarter profit, driven by growth in its loan book.
- 01/15/2020
|
Why Earnings Season Could Be Great for PNC Financial (PNC)
- PNC Financial (PNC) is seeing favorable earnings estimate revision activity and has a positive Zacks Earnings ESP heading into earnings season.
- 01/14/2020
|
Which Big Bank has the Best Earnings Chart?
- Fourth quarter earnings season kicks off with the big banks. They have been ignored by investors but are they hidden gems?
- 01/13/2020
|
Fee Income Growth to Aid PNC Financial (PNC) in Q4 Earnings
- Improved mortgage and investment banking performance is expected to support PNC Financial's (PNC) Q4 results amid lower interest rates.
- 01/13/2020
|
5 Major Bank Stocks Poised to Beat Earnings Estimates in Q4
- Major U.S. banks likely had a decent Q4 on upswing in client activities, aiding trading revenues, and upbeat underwriting business, partly muted by soft loan growth and interest-rate declines.
- 01/13/2020
|
4 Must-Own Bank Stocks Ahead of Q4 Earnings
- Increase in consumer loan, strong trading revenues and share buybacks may help banks stay afloat this earnings season despite falling interest rates.
- 01/13/2020
|
Bank of America, Citigroup, Morgan Stanley, Wells Fargo and More Major Banks Reporting This Week
- A handful of the major banks are reporting their most recent financial results this coming week to kick off the new earnings season.
- 01/12/2020
|
Citigroup Is BofA's Bank Stock Pick Of The Decade
- Big bank earnings season is right around the corner, and Bank of America has adjusted its coverage of the group, including naming its top stock pick of the decade.
- 01/09/2020
|
RBC analyst lays out his top Big Bank stock picks
- Gerard Cassidy, head of U.S. Bank Equity Strategy at RBC Capital Markets, joins "Squawk Box" to discuss his top picks in the banking sector and what he expects from the upcoming earnings.
- 01/09/2020
|
Warren Buffett Bought These 9 Stocks in 2019
- The greatest long-term investor of our generation did some shopping last year.
- 01/01/2020
|
2019 Has Been Good for Bank Stocks. How Will 2020 Be?
- Banks are expected to continue benefiting from various positive developments in 2020, after a good 2019.
- 12/26/2019
|
PNC Financial's Ratings Affirmed by Moody's, Outlook Stable
- PNC Financial's (PNC) diverse revenue sources, strong asset risk profile and healthy liquidity impress Moody's.
- 12/20/2019
|
Fed Likely to Pause Rates in 2020: Bank Stocks Worth Buying?
- The Fed kept interest rates unchanged at the Federal Open Market Committee (FOMC) Meeting and forecasts reflect no change of rate throughout 2020.
- 12/12/2019
|
Major Regional Bank Stocks Outlook Rosy on Decent Loan Rise
- The Zacks Major Regional Banks industry includes the nation’s largest banks by assets — most operating globally.
- 12/05/2019
|
Why Bank Stocks are Racing Past S&P 500 as Rates Plunge
- Bank stocks are rallying as funding costs fall and valuations look cheap.
- 11/15/2019
|
PNC Financial: Improving Operating Efficiency And Exploring New Markets
- PNC Financial: Improving Operating Efficiency And Exploring New Markets
- 11/10/2019
|
RBC Says Investors Need to Own the Top Bank Stocks Now
- One metric that Wall Street analysts often count on when doing their work on various sectors is comparable periods in the past.
- 11/08/2019
|
Should Value Investors Pick PNC Financial (PNC) Stock?
- Is PNC Financial (PNC) a great pick from the value investor's perspective right now? Read on to know more.
- 10/21/2019
|
The PNC Financial Services Group, Inc. (PNC) CEO William Demchak on Q3 2019 Results - Earnings Call Transcript
- The PNC Financial Services Group, Inc. (PNC) CEO William Demchak on Q3 2019 Results - Earnings Call Transcript
- 10/16/2019
|
PNC Financial (PNC) Q3 Earnings Top Estimates on High Revenues
- PNC Financial's (PNC) Q3 performance highlights top-line strength, partly offset by elevated expenses and provisions.
- 10/16/2019
|
PNC Financial profit tops estimates on higher loan growth
- PNC Financial posted better-than-expected third quarter results on Wednesday. The company said net interest income rose 1.5% to $2.50 billion, as higher loans and borrowing costs offset lower interest rates.
- 10/16/2019
|
Will Soft Lending Hurt PNC Financial (PNC) in Q3 Earnings?
- PNC Financial's (PNC) Q3 earnings are likely to reflect muted net interest income due to disappointing commercial lending scenario. Yet, rise in consumer service revenues might support fee income.
- 10/14/2019
|
PNC Financial Divests Franchise Finance Business to MidCap
- PNC Financial (PNC) continues to restructure and streamline its business in order to better focus on core and profit making operations.
- 10/03/2019
|
Baird Says US Banks Still Have Big Value: 4 to Buy Now
- One of the few sectors that enjoy rising interest rates is the financial sector, and when the Federal Reserve started lowering interest rates this summer and followed up with more earlier this month, some of the top bank stocks were hit hard.
- 09/27/2019
|
Bank Stock Roundup: Fed Cuts Rate, JPMorgan, U.S. Bancorp & Wells Fargo in Focus
- Federal Reserve's second rate cut this year likely to impact banks' net interest margin.
- 09/20/2019
|
Wall Street banks are upping bets on their potential fintech competitors
- The biggest U.S. banks are ramping up investments in some of their potential competitors.
- 09/15/2019
|
Bank Stock Roundup: Rising Treasury Yields, Dismal View, BAC, C, USB in Focus
- Rising long-term treasury yields are likely to support banks' financials to some extent. But lower interest rates and other concerns are expected to be headwinds.
- 09/13/2019
|
PNC Financial (PNC) to Open Branches in Untapped Markets
- PNC Financial (PNC) plans to open 25 branches in untapped markets by the end of 2020, in turn, boosting the bank's digital service domain.
- 09/12/2019
|
3 Dividend Plays to Buy And Hold For 5 Years
- It's fun chasing the "next big thing", but it's also prudent investing to have a few strong yielding dividend plays in the portfolio. Here are a few I like.
- 08/30/2019
|
PNC Is Still An Attractive Bank
- The recent pullback in share price offers a good entry point.
- 08/26/2019
|
Your Guide to the 10 Biggest Bank Stocks
- Here’s your guide to the largest publicly traded financial institutions in the U.S.
- 08/14/2019
|
PNC Financial Services (PNC) is a Top Dividend Stock Right Now: Should You Buy?
- Dividends are one of the best benefits to being a shareholder, but finding a great dividend stock is no easy task. Does PNC Financial Services (PNC) have what it takes?
- 08/06/2019
|
Fed Cuts Rates: Are Bank Stocks Still Worth Betting on?
- Despite the Fed interest rate cut, investing in bank stocks seems to be a good idea given several positives.
- 08/01/2019
|
Pnc Financial Services Group Inc (PNC) President/CEO William S Demchak Sold $10.5 million of Shares
- President/CEO of Pnc Financial Services Group Inc (30-Year Financial, Insider Trades) William S Demchak (insider trades) sold 75,000 shares of PNC on 07/23/2019 at an average price of $140.63 a share.
- 07/24/2019
|
This is Why PNC Financial Services (PNC) is a Great Dividend Stock
- Dividends are one of the best benefits to being a shareholder, but finding a great dividend stock is no easy task. Does PNC Financial Services (PNC) have what it takes?
- 07/18/2019
|
PNC Financial Services Group, Inc. (PNC) CEO William Demchak on Q2 2019 Results - Earnings Call Transcript
- PNC Financial Services Group, Inc. (PNC) CEO William Demchak on Q2 2019 Results - Earnings Call Transcript
- 07/17/2019
|
PNC Financial (PNC) Q2 Earnings Beat Estimates, Revenues Up
- PNC Financial's (PNC) Q2 performance highlights top-line strength, partly offset by elevated expenses and provisions.
- 07/17/2019
|
PNC Financial Services Reports Q2 Earnings Beat
- PNC Financial Services (NYSE: PNC) reported second-quarter earnings of $2.88 per share, which beat the analyst consensus estimate of $2.82.
- 07/17/2019
|
Why PNC Financial (PNC) Might Surprise This Earnings Season
- PNC Financial (PNC) is seeing favorable earnings estimate revision activity and has a positive Zacks Earnings ESP heading into earnings season.
- 07/16/2019
|
5 Large-Cap Stocks Poised to Beat on Earnings in Q2
- Despite investor concerns, a few large companies are likely to beat earnings estimates in the second quarter.
- 07/16/2019
|
Is a Beat in Store for PNC Financial (PNC) in Q2 Earnings?
- PNC Financial's (PNC) Q2 earnings are likely to reflect muted net interest income growth. Also, rise in consumer service revenues might support fee income.
- 07/15/2019
|
6 Major Banks Set to Trump Q2 Earnings Amid Tough Backdrop
- Lingering geopolitical concerns, trade jitters and muted loan growth are expected to hurt major banks' Q2 earnings. But there are a few stocks in the industry that are likely outperform their peers.
- 07/12/2019
|
4 Large-Cap Stocks Announce Quarterly Dividends
- Four large-caps dividend payers declared quarterly distributions on July 9.
- 07/10/2019
|
PNC Financial Is A Great Bank
- PNC Financial Services is a very conservatively run bank which has strong and strict underwriting standards.
- 07/10/2019
|
PNC Financial Services (PNC) Earnings Expected to Grow: What to Know Ahead of Next Week's Release
- PNC Financial Services (PNC) possesses the right combination of the two key ingredients for a likely earnings beat in its upcoming report. Get prepared with the key expectations.
- 07/10/2019
|
PNC Financial Rewards Shareholders With 21% Dividend Hike
- PNC Financial's (PNC) recent dividend hike reflects steady capital-deployment activities.
- 07/10/2019
|
Why PNC Financial Services (PNC) is a Great Dividend Stock Right Now
- Dividends are one of the best benefits to being a shareholder, but finding a great dividend stock is no easy task. Does PNC Financial Services (PNC) have what it takes?
- 07/02/2019
|
Warren Buffett Gets More Pay From Banks After Stress Tests
- U.S. banks aced their stress test from the Federal Reserve on Thursday, which was good news for their shareholders, particularly one of their biggest, Warren Buffett (Trades, Portfolio).
- 07/01/2019
|
These are the best banks for your buck, according to this equity analyst
- CNBC's "Power Lunch" team discusses the bank stock rally after raising dividends with Jason Goldberg, senior equity analyst at Barclays.
- 06/28/2019
|
Should Value Investors Pick PNC Financial Services (PNC) Stock?
- Is PNC Financial Services (PNC) a great pick from the value investor's perspective right now? Read on to know more.
- 05/20/2019
|
Why Is PNC Financial Services (PNC) Up 2.9% Since Last Earnings Report?
- PNC Financial Services (PNC) reported earnings 30 days ago. What's next for the stock?
- 05/12/2019
|
Federated to Buy Mutual Funds Worth $14B From PNC Financial
- Federated Investors (FII) to acquire liquidity, equity and fixed-income mutual funds of PNC Financial (PNC).
- 05/08/2019
|
PNC Financial Posting Healthy Loan Growth, But Cycle Peak Pressures Emerging
- PNC beat expectations with stronger than expected loan growth and well-controlled expenses, but deposit and credit costs are rising, with LLPs doubling from last year.
- 04/16/2019
|
Big Bank Earnings Impress in Q1: 5 Great Picks
- U.S. banks have been facing a number of challenges, which is why investors were apprehensive about earnings numbers. The Fed’s new-found dovishness, a flattening yield curve, a government shutdown and declining trading revenues are major headwinds confronting the sector at present.
- 04/15/2019
|
PNC Financial Services Group, Inc. (PNC) CEO Bill Demchak on Q1 2019 Results - Earnings Call Transcript
- PNC Financial Services Group, Inc. (PNC) CEO Bill Demchak on Q1 2019 Results - Earnings Call Transcript
- 04/12/2019
|
Major Banks Post Strong Q1 Earnings Results
- Major Banks Post Strong Q1 Earnings Results
- 04/12/2019
|
PNC Financial (PNC) Q1 Earnings Beat on Higher Revenues
- PNC Financial's (PNC) first-quarter 2019 results reflect top-line strength, partly offset by elevated expenses.
- 04/12/2019
|
PNC Financial quarterly profit rises 2.7%
- PNC Financial Services posted a 2.7 percent rise in quarterly profit on Friday as the U.S. regional bank earned more interest income.
- 04/12/2019
|
Financials Kick Off Q1 '19 Earnings, Friday, April 12th, 2019
- Financials have been underperforming for 15 months now.
- 04/12/2019
|
Cramer: We don't need to like the bankers, just their earnings
- Jim Cramer breaks down Wednesday's banking hearing on Capitol Hill and explains what he's looking for when the first banks report earnings Friday.
- 04/10/2019
|
Can Fee Income Growth Aid PNC Financial's Q1 Earnings?
- PNC Financial's Q1 earnings are likely to reflect net interest income growth and rise in fee income, majorly in consumer and corporate service segments.
- 04/10/2019
|
A U.S. Bancorp - PNC Financial Tie-Up Could Be A Win-Win
- Mergers of equals may become a more significant trend in banking, and U.S. Bancorp and PNC could overcome their M&A reluctance to create a powerful national franchise.
- 04/08/2019
|
PNC Financial Services Earnings Expected to Grow: What to Know Ahead of Next Week's Release
- PNC Financial Services doesn't possess the right combination of the two key ingredients for a likely earnings beat in its upcoming report. Get prepared with the key expectations.
- 04/05/2019
|
Bank Stock Roundup: Fed Pauses Rate Hike, JPMorgan & Wells Fargo in Focus
- Banking stocks put up a lackluster show during the week after Federal Reserve's decision of no more rate hikes in 2019.
- 03/22/2019
|
Fed looks like they're going to lean towards financial assets, says State Street's Arone
- Michael Arone of State Street Global Advisors, Omair Sharif, Sociele Generale senior U.S. economist, and CNBC's Steve Liesman and Rick Santelli joins 'The Exchange' to discuss their takeaways from Fed chair Jerome Powell's testimony before the House Committee on Financial Services.
- 02/26/2019
|
Here's what stocks Warren Buffett's hedge fund is investing in
- CNBC's Leslie Picker reports on Warren Buffet's hedge fund Berkshire Hathaway's latest filing with the SEC, which has some details that have surprised market participants.
- 02/21/2019
|
Here are the two industries that big hedge funds sold off in Q4: Financial
- It's the time of the season when investors are awaiting the SEC 13F filings from major hedge funds. CNBC's Leslie Picker reports on how some of the biggest hedge funds handled the fourth quarter volatility.
- 02/14/2019
|
Scale working for first time in banking industry, says KBW CEO
- BB&T will buy SunTrust Bank for $28.24 billion in an all-stock deal. The companies called it a merger of equals, valued at $66 billion. CNBC's team is joined by Thomas Michaud, CEO of KBW, to talk about how this merger will make the company the sixth-largest bank.
- 02/06/2019
|
Discounted stocks are popping after earnings reports, says investment strategist
- CNBC's "Closing Bell" team is joined by Lindsey Bell, investment strategist at CFRA Research, senior markets commentator Mike Santoli, and Rick Santelli to discuss markets.
- 01/17/2019
|
There is an existential issue about Goldman Sachs: Gasparino
- FBN's Charlie Gasparino on the state of the financial sector and the partial government shutdown over border wall funding.
- 01/13/2019
|
Ending threat of recession will be catalyst to bank rally, says former Wells Fargo CEO
- Dick Kovacevich, former CEO of Wells Fargo, and Bill Carcache, Nomura Instinet analyst, debate the prospects of a bank rally.
- 12/10/2018
|
Choose small-cap companies with good business model, says Sally Pope Davis
- Sally Pope Davis, managing director with Goldman Sachs Asset Management, talks with CNBC's "Power Lunch" team about small-cap strategy.
- 12/09/2018
|
Warren Buffett buys bank, tech stocks
- Sevens Report Founder Tom Essay on Berkshire Hathaway CEO Warren Buffett's stock picks.
- 11/14/2018
|
Big bank trades: 5 picks
- The "Fast Money" traders give you 5 trades in financials.
- 10/09/2018
|
PNC, Bank of America, Qorvo & JPMorgan
- The "Halftime Report" traders give their top stocks to watch for the second half.
- 07/15/2018
|
Jim Cramer on JPMorgan, Citigroup, Wells Fargo, PNC and Casino Stocks
- TheStreet's founder and Action Alerts PLUS Portfolio Manager Jim Cramer weighs in on Friday's trending stocks from the floor of the New York Stock Exchange including JPMorgan Chase, Citigroup, Wells Fargo, PNC and casino stocks like Wynn Resorts.
- 07/12/2018
|