Euroseas Ltd. (ESEA) on Q4 2021 Results - Earnings Call Transcript
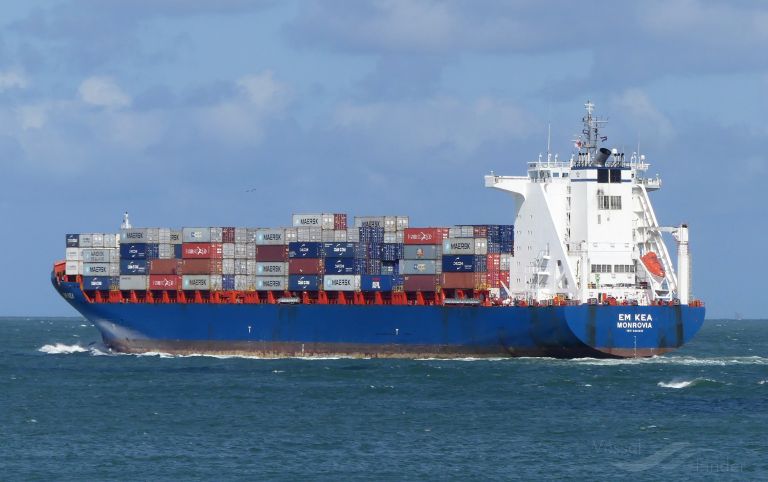
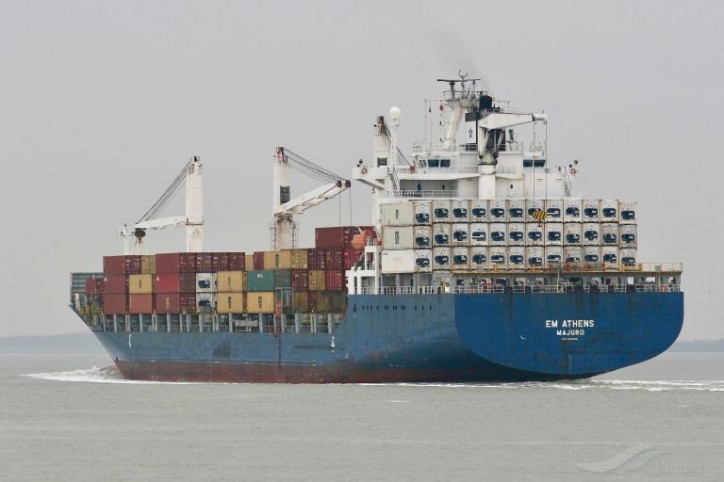
Operator: Thank you for standing by, ladies and gentlemen, and welcome to the Euroseas Conference Call on the Fourth Quarter 2021 Financial Results. We have with us Mr. Aristides Pittas, Chairman and Chief Executive Officer; and Mr. Tasos Aslidis, Chief Financial Officer of the company. At this time, all participants are in a listen-only mode. There will be a presentation followed by a question-and-answer session. I must advise you that this conference is being recorded today. Please be reminded that the company announced their results with a press release that has been publicly distributed. Before passing the floor to Mr. Pittas, I would like to remind everyone that in today's presentation and conference call, Euroseas will be making forward-looking statements. These statements are within the meaning of the federal securities laws. Matters discussed may be forward-looking statements, which are based on current management expectations that involve risks and uncertainties that may result in such expectations not being realized. I kindly draw your attention to slide number two of the webcast presentation, which has the full forward-looking statement and the same statement was also included in the press release. Please take a minute to go through the whole statement and read it. And now I would like to pass the floor to Mr. Pittas. Please go ahead, sir. Aristides Pittas: Good morning ladies and gentlemen, and thank you all for joining us today for our scheduled conference call. Together with me is Tasos Aslidis, our Chief Financial Officer. The purpose of today's call is to discuss our financial results for the quarter ended and full year December 31, 2021. Let us turn to slide three. Our income statement highlights are shown here. The fourth quarter of 2021, was a seminal one for Euroseas, as we recorded the highest net income level in our history. For the fourth quarter of 2021, we reported total net revenues of $38.3 million and net income attributable to common shareholders of $22.7 million. Adjusted net income attributable to common shareholders for the period was $22.9 million, or $3.18 per share and $3.17 per share basic and diluted respectively. Adjusted EBITDA for the period stood at $26.1 million. For the full year of 2021, our net revenue was $93.9 million and net income attributable to common shareholders was $42.3 million. Adjusted net income attributable to common shareholders for the period was $42 million, or $6.02 and $6.01 per share basic and diluted respectively. Adjusted EBITDA for the period totaled at $52.7 million. Notably, net revenues for the quarter and full year, as well adjusted EBITDA were higher than the previous years by multiple measures of magnitude, as can be seen on the slide. Our CFO, Tasos Aslidis will go over financial highlights in more detail later on in the presentation. Please turn to slide four where we discuss our recent chartering and operational developments. Motor vessel, Marcos V was bought with the charter for approximately 36 to 42 months at $42,000 per day. The EM Astoria was fixed for a minimum period of about 36 to 38 months at $65,000 per day for the first year, followed by $50,000 per day for the second year and therefore fixed a $20,000 per day for the remaining period. Evridiki G, was extended for a minimum period of 36 to 38 months at $40,000 per day. The EM Corfu was fixed for 36 to 40 days at $5,125 per day as repositioning trip to reach drydock destination and thereafter fixed for 36 to 38 months at $40,000 per day as well. Furthermore, Jonathan P was bought with the charter attached for the minimum period of 35 to 37 months at $27,000 per day. Synergy Keelung had it option declared by the charterer for approximately 8 to 12 months at $14,500 per day. Whilst, the Synergy Oakland was fixed for about 48 to 51 months four-year, at $42,000 per day, the vessels to be delivered by April 15, 2022. The previous charter of motor vessel Synergy Oakland of $202,000 per day exceeded its maximum duration by about 25 days due to both delays with payment of the higher charter rates to the company continuing during the extension. However the extension resulted in the loss of the subsequent short term charter of $130,000 per day that was to be performed before the four-year charter would kick in. The vessel after an idle day of about 15 days was chartered for single voyage charter at the $160,000 per day after the completion of which it will commence the four-year charter. The new charter arrangements will result in about the same average rate and total revenues as the original arrangements. Further more, two of our vessels incurred repairs and were involved in specials surveys with drydocks in the fourth quarter. Diamantis P for about 49 days between September and October 2021 and EM Corfu since 29th of December till about now no vessels were idle or commercial offhire during the fourth quarter. Please turn to slide five where we'll review our recent sale and purchase highlights. Two vessels were delivered during the fourth quarter of 2021, the Jonathan P, 1700 teu containership was delivered in October. And Marcos V, the 6300 teu containership was delivered in December 2021. Also as previously announced, on January 28, 2022, we signed the contracts for the construction of two eco-designed fuel efficient containerships similar to the ones of that in June 2021. The vessels would have a carrying capacity of 2,800 teu each and will be built at Hyundai Mipo Dockyard in South Korea. The two newbuildings are schedule to be delivered during the fourth quarter of 2023 and first quarter of 2024 respectively. The total consideration for each of these two newbuilding contracts is approximately $43.15 million and will be financed with the combination of debt and equity. This brings our newbuilding program to four-vessels and solidifies our market presence in the larger feeder sector. Both vessels adhere to the current greenhouse gas emission and other requirements and significantly improve our fleet profile both as concerns age and eco characteristics. Its noteworthy, that the new vessels will consumer about 30% less fuel that previous generation non eco ships. Please turn to slide six, where you can see our current fleet profile. Euroseas current fleet is comprised of 16 vessels on the water, including 10 feeder containerships and six intermediate container carries. Euroseas 16 containerships have a capacity of 50,000 teu and an average age of 17 years. After the delivery of the four feeder containership newbuildings in 2023 and the first half 2024 Euroseas' will consist of 20 vessels with the total carrying capacity of close to $62,000 teu. Slide seven shows our vessel employment chart. As you may see, we have charted almost more than 92% of available capacity in 2022. About 62% of our available capacity in 2023 and about 40% of available days in 2024 taking to account the newbuildings as well. At the contracted EBITDA level of about $113 million for 2022 and $92 million for 2023. Our contracted average Time Charter rate for 2022 stands at about $31,250 per day, whilst for 2023 and 2024 its higher, estimated at $33,000 per day and $33,500 per day respectively. Let's now turn to slide nine to review how the Time Charter market in general has spread over the period. As you can see, six to 12 month Time Charter rates continue to push to new highs despite short lived to retreat in container rates to witness during November and December of 2021. Please turn to slide 10 to go over the overall market highlights. As we said, Time Charter rates across all segments skyrocketed over the past 12 months and have reached all time highs. Additionally, during the fourth quarter, the average secondhand price index rose by about 16% in Q4 over Q3. Price increases varied across different age group with the elder vessels have increased well in excess of 100% in 2021. During the fourth quarter, newbuilding prices also increased by approximately 3% due to steel prices being on the rise and high demand for newbuildings on the back of the general containership market rise. The idle containership fleet as of the beginning of 2022 stands at only about 130,000 teu, 0.5% of the fleet, the lowest level ever. These are vessels that would probably never be reactivated anyway. The percentage of containership scrap to-date has dropped dramatically to approximately 12,000 teu. Again, the lowest point ever. And this is of course, despite the fact that prices have increased to over $615 per lightweight ton due to the high demand for steel. Overall, the fleet grew by about 3.9% in 2021, without of course accounting for the idle deactivations. The order book has significantly increased mainly through larger vessels with the current order book to fleet ratio hovering around 24% compared to just 10% a year ago. Please turn to slide 11. The IMR -- IMF's revised outlook is largely led by growth markdowns in the two largest economies, the U.S. and China. According to the January 2022, IMF report, global growth is expected to decrease from 5.9% in 2021 to 4.4% in 2022, half a percentage point lower since the previous projections in October. However, the 0.5% growth, the IMF expects will likely be gained in 2023 with forecast up from 3.3% in October, 2021 to 3.8% in January, 2022. Despite slowing down growth prospects for the emerging markets and developing economies are expected to go back to the pre-pandemic trend by 2023, except for India, which is expected to be steady at around 9%. Growth forecasts remain promising for advanced economies with Japan and the ASEAN-5 doing better than 2021, while the U.S. citing tighter fed policy and an anticipated halt to any further stimulus spending by Congress has a reduced growth forecast for 2022 from 5.2 percentage points to 4%. China's economic growth is projected to be only 4.8% in 2022 before picking up again in 2023. As the Central Bank steadily ramps up policy easing towards downturn. The lower growth rate underlines multiple headwinds facing the world's second largest economy due to a property downturn, a crackdown on debt, tougher pollution measures and strict COVID-19 curbs which have hit consumption. For 2022 and 2023 containerized trade is expected to grow at healthy levels of 3.6% and 3.5% respectively. Please turn to slide 12 to review the containership age profile and delivery schedule. As you can see in the containership age profile chart located on the left side of the slide, we have a young fleet with a mere 8% of ships being above 20 years old. However, the older vessels are mainly concentrated in the smaller classes where our ships operate. The right side chart shows the delivery schedule of the current containers of the book, which is expressed as a percentage of the fleet. Circle figures for 2022 and to 2025, reflect the anticipated fleet growth before scrapping and slippages. Apparently, the total containership order book stands at 24.3% of the fleet, which is astonishing compared to a year ago when it stood at merely 10%. The majority of the deliveries are scheduled for the second half of 2023 onwards, and even then will be concentrated on the larger sized vessels. Please turn to slide 13 where we discuss our outlook summary. As previously mentioned, global recovery continues, yet new COVID-19 variants, rising energy prices and elevated inflation still weigh in and may slow economic growth. Containership trade remains positive with moderate supply growth in 2022, accelerating in 2023 and 2024. Port congestion has continued to significantly impact the container shipping markets leading to excessive wait times and disrupting operative schedules. These logistical bottlenecks have resulted in new highs in container freight rates, which are expected to remain throughout 2022. The short-term outlook looks optimistic, reinforced by logistical disruptions and firm trade demand. Additionally, limited supply growth in 2022 should provide some rate support before increased newbuilding delivers in 2023. The medium to long term, that is in 2023 and beyond, fundamentals are very complex, with a range of factors likely to have an impact. Firstly and certainly, uncertainty may arise if demand for vessel wanes once supply chain disruptions ease. Secondly, material supply pressure from 2023 onwards may overtake demand growth due to increased deliveries. But last and not least, new environmental regulations will probably result in even slower steaming by 2023, 2024, effectively removing capacity from the market. The balance is very difficult to determine. Let's move to slide 14. The left side of the slide shows the evolution of the one year time charter rates for containers of 2,5000 teu since 2000. As discussed, we are witnessing the highest charter rates in the last 20 years. According to Clarkson's last week, one year daily time charter rates for 2,500 teu containerships stood at $76,000 per day. The right hand side of the slide shows vessel values in relation to historical prices since 2012. As we can see, current containership values stand at about $52 million and have significantly increased above median and average levels and are now at the highest levels over the last decade. There is no doubt that at some point both prices and charter rates will need to correct, but the big question is when will this happen and how far further will they have reached till then. Because the only clear thing today is the lack of sufficient capacity to service the world's needs of today. In this unsteady environment we have secured and continued to secure as much earnings as possible and are looking to utilize the vast amount of liquidity we are creating in the optimal way to folds a strong balance sheet and grow the company in the manner that will continue to provide it with top returns in the evolving global shipping environment for the benefit of our shareholders. And with that, I will now pass the floor to our CFO, Tasos Aslidis to go over our financial highlights in further detail. Tasos Aslidis: Thank you very much Aristides. Good morning for me as well ladies and gentlemen. I will now take you through the next five slides of our presentation and give you an overview of our financial highlights for the fourth quarter and full year of 2021 and compare them with our results in the equivalent periods of 2020. For that let's turn to slide 16. For the fourth quarter of 2021, the company reported total net revenue of $38.3 million, representing a 218% increase over total net revenues of $12 million during the fourth quarter of 2020. The increase was predominantly due to the higher average Time Charter rates our vessels earned in the fourth quarter of last year compared to the corresponding period of 2020. For the fourth quarter of 2021 the company reported net income and net income applicable to common shareholders of $22.7 million as compared to a net income of $0.6 million and a net income attributable to common stakeholders of $0.4 million for the fourth quarter of 2020. Interest and other financing costs for the fourth quarter of 2021 amounted to about $0.78 million comparable to $0.8 million that we had for the same period of 2020, during which though we also recorded a loss on extinguishment of debt of about $0.5 million. Adjusted EBITDA for the fourth quarter of 2021 was $26.1 million compared to $2.1 million for a corresponding period of 2020, reflecting a 132% increase over the previous periods. Basic earnings per share attributable to common shareholders for the fourth quarter of 2021 were 3.15, while diluted earnings per share were $3.13 calculated respectively on $7.21 million and $7.24 million basic and diluted weighted average number of sharees outstanding compared to basic diluted earnings per share of $0.07 for the fourth quarter of 2020, calculated a 6.15 million basic and diluted number -- rated average number of shares outstanding. Excluding the effects on the income attributable to common shareholders for the quarter, the unrealized loss and derivatives, the amortization of below market time charter acquired and the depreciation charged due to the increased value of the vessels acquired with the low market time charters. The adjusted earnings attributable to common shareholders for the quarter ended December 31, 2021 which has been $3.18 basic and $2.17 diluted compared to an adopted loss of $0.16 per serve basic and diluted for the quarter -- for the fourth quarter of 2020. Usually secured channels do not include these items in the public estimates of earnings per share, and that's why we're making this adjustment as well. Let's now move to the right half of the slide to discuss the same figures for the full year of 2021. For the full year of 2021, the company reported total net revenue of $93.9 million, representing a 76% increase over total net revenues of $53.3 million during the 12 months of 2020. The company reported a net income for 2021 of $42.9 million and then net income attributable to common shareholders of $42.3 million, as compared to a net income of $4 million, net income attributable to common shareholders of $3.3 million for 2020. Interest and other financing cost for the 12 months of 2021 amounted to $2.8 million compared to $4.1 million for 2020, during which year we also recorded a loss in the extinguishment of debt $0.5 million as I mentioned earlier. This decrease of interest expenses is due to the lower average level of debt we take during 2021 as compared to the previous year. Our debt only increased in the fourth quarter of 2021 when we partly financed with debt our latest two acquisitions. Adjusted EBITDA for 2021 was $52.7 million compared to $11.8 million during 2020. Basic earnings per share attributable to common shareholders for 2021 were $6.06 and diluted earnings per share were $6.05 calculated on $6.98 million and $6.99 million of basic and diluted weighted average number of shares outstanding compared to basic and diluted earnings per share of $0.58 for 2020. Again, excluding the effect on the income attributable to common shareholders for 2021 of the unrealized gain on derivatives, the amortization of the below market prime charter supply, the depreciation charge due to the increased value of the vessels acquired with below market charters and the net loss in the sale of a vessel, the adjusted earnings attributable to common shareholders for the year of 2021, which has been $6.02 basic and $6.01 diluted compared to a marginal adjusted loss of essentially $0 per share basic and diluted for 2020. Let's now move to slide 17 to review our fleet performance. We will start our review by looking first at our fleet utilization rates for the fourth quarter of 2021 and compare them to the same for 2022. As usual our fleet utilization rate is broken down into commercial and operational. During the fourth quarter of 2021, our commercial utilization rate was a 100%, while our operational utilization rate was 98.5% compared to 98.5% commercial and 96.3% operational for the fourth quarter of 2020. I should remind you here that our utilization rate calculation does not include vessels in drydock or schedule repairs, defense such events should be procured during the period we are considering. On average 15.01 vessels were owned and operated during the fourth quarter of 2021, earning an average time charter equivalent rate of $29,994 per day compared to 14.43 vessels born and operated in the same period the fourth quarter of 2020, earning on average $10,497 per day. Our total daily operating expenses including management fees, general and administrative expenses, but excluding drydock costs averaged $7,708 per vessel per day during the fourth quarter of 2021 compared to $7,164 per vessel per day for the fourth quarter of 2020. Our cash flow break-even rate during the fourth quarter of 2021 was about $11,950 per vessel per day compared to $8,215 per vessel per day for the fourth quarter of 2020 recorded during which we should not do any loan repayments. Let's now look at the right part of the slide to review the same figures for the full year. During 2021, our commercial utilization rate was again 100%, while our operational utilization rate was 98.5% compared to 97.5% commercial and 98% operational for 2020. On average, during 2021, 14.25 vessels were owned and operated, earning an average time charter equivalent rate of $19,309 per day compared to 17.23 vessels during 2020, earning an average -- on average $9,445 per day. Our total operating expenses, again, including management fees and G&A expenses that excluding drydocking costs for 2021 amounted to $7,212 per vessel per day compared to $6,431 per vessel per day for the previous year 2020. Let's look again at the bottom of this table to review the cash flow breakeven rate we had for the year, which amounted to $10,793 in 2021 compared to $8,357 during 2020. Let's move now to slide 18. You should become familiar with the slide by now. We have included this slide in the last three or four calls to provide our shareholders and investors with the tool to assess the earnings potential of our fleet in the coming periods. The table shown in this slide has two parts. The first part refers to our already in place contracts. The table shows the available days for hire, making assumptions for the scheduled drydockings, the number of contracted days in each period that we're reviewing, as well as the difference of the two what we call the remaining open days of our fleet. As you can see in the table, almost all of our vessel available days are contracted for 2022, 92%, while 62% of our fleet available days for 2023 are also contracted. For the contracted days, the table shows the average conductor rate, which allows you by making an assumption for the OpEx and G&A expenses per day to estimate the likely EBITDA contribution. For the remaining open days, whoever uses this calculator needs to make an assumption about the daily rate to be earned, which would allow him or her to estimate the EBITDA contribution of the open days. To provide an indicative calculation, this one used the same rate as the blended contracted rate, one can see the effect on the total EBITDA for 2022 and 2023. This overall exercise is meant to provide what's the tool to calculate our EBITDA for 2022, 2023 even 2024 if one wants to extend it by entering one's own assumptions about the rates for the open days. It is hard though to let go unnoticed that for 2022 a year that more than 90% of our fleet is contracted out. We expect to likely double our EBITDA as compared to 2021 and see the figure that this figure could even go farther in 2023 if of course the rate assumptions in the table comes through. Let's now move to slide 19 to review our debt profile. On the top part of the slide we can see our scheduled current debt repayments over the next several years. Our loan repayment schedule for this year stands at $27.4 million with debt repayments of existing debt going down over the next three years. In addition to the regular repayment the chart shows like blue bars are stable value payments. In 2022, we have a small balloon payment of $1.9 million. We have $30.7 million due to be paid in 2023, and a further $1.8 million balloon in 2024. In the past which have typically financed our balloon payments at least the larger ones and we expect to be able to do so in the future if we choose to do so. Two further points here. First, we have two vessels that are currently unencumbered, the Joanna and Akinada Bridge. Second point that I would like to make is that chart does not include the debt that we expect to assume for the financing -- the part financing, we are planning to take to finance our four newbuildings during 2023 and early 2024. For our newbuildings, we typically make the initial payments with our own funds and draw a loan to finance the last and large repayment at the delivery of the resume. The final quick note on this slide on the cost of our debt as it relates to the loans outstanding rents of 11 years. The average margin on our debt is about 3%, I'm assuming the LIBOR rate of 0.3%, our senior debt cost, our current senior debt cost is on average 3.3% and each one includes the cost of our interest rate swaps is averaging 3,4%. Looking at the bottom of this table, we can see our cash flow breakeven level expectation for the next 12 months is $1 per vessel per day. You can see with our loan repayments that we just reviewed over the next 12 months calculate a $4,250 per vessel per day, contribution to our cost low breakeven level. If we make similar assumptions for the remaining components of our cash flow breakeven level, our operating expenses, G&A expenses,, interest payments and drydocking costs will come up with the cash flow breakeven level for the next 12 months of just around $13,075 per vessel today. Let's now move to slide 20. This slide provides some highlights from our balance sheet are just to reflect the market value of our fleet. As of December 2021, on a book value basis first and on our asset side, we had costs and other assets for about $37.1 million and the book value for our vessels including advances for the newbuildings and the acquisition of the vessels including that with the acquired vessel Jonathan P and Marcos V of $183.4 million giving us a total book value for our assets of about $221 million. On the liability side, we had an outstanding bank debt of $119 million and other liabilities of $8.5 million. However, as I started mentioning, the market value of our fleet is much higher than its book value even if adjusted for the negative value of our charters, the latter result of increasing market and continuously increasing market. Specific rates made with our vessels were at the end of last year about $445 million inclusive of the appreciation of the value of our newbuilding contracts. If we use that effect of the book value for our vessels, we can calculate the net asset value for our fleet to be around $337 million or around $46 per share. Recently our shares have been traded in the range of $30 to $34 per share. And although this share price reflects a not worthy increase in the beginning of the year, it still represents a significant discount to our net asset value per sale thus offering good appreciation potential for our shareholders and good investment opportunities for other investors. And with that, I would like to close my short presentation and pass the floor back to Aristides to continue our discussion. Aristides Pittas: Thank you, Tasos. Let me open up the floor for any questions that we may have. Operator: Thank you. We will now begin the question and answer session. We will now take our first question. Please go ahead. Your line is now open. Tate Sullivan: Well, good day. This is Tate Sullivan from Maxim Group. I'm just starting -- just a couple follow-up questions with your comments about the order book currently still being composed of much larger vessels for 2023, particularly for entrance into the market in 2023. Can you remind us of the benefit of the operating smaller ships in your fleet and taking delivery of smaller ships? And maybe even comment on the future composition of the containership, please? Aristides Pittas: Obviously, there is always a cascading effect when you have containerships. They all carry the same kind of cargo, which is containerships. But the smaller vessels can go into smaller ports where the bigger ones cannot. And the bigger ones tend to go from into the bigger ports where they discharge the cargo there and from there smaller ships pick up the cargo and take it small -- smaller distances towards other smaller ports. So all type of vessels are needed. The big ordering is happening on the big vessels. The ones that do the TransAtlantic and TransPacific tradings mainly. So you realize that we also need ships that are smaller and not a lot of are being built of that -- of those smaller ships. And the ones that exist are also the elder vessels around. So we think this is kind of a relatively niche market to be in and we're traditionally focused on that market. Tate Sullivan: Thank you. And with, I mean most of your capacity spoken for this year, most of your days contracted days with, I mean, look, is there any chance newbuild, additional newbuild capacity or ship capacity opens to build you new ships in the next two years or is really today the earliest deliveries still for multiple years if you do decide to build above and beyond the four newbuilds you have on order? Aristides Pittas: We are considering the possibility to build new vessels as well. We're still looking at that possibility. The shipyards are quite full with new orders though. So you cannot get them with prompt deliveries these days, which is a drawback, but we will see. Tate Sullivan: Okay. Thank you. And just on a topic we talked about before just targeted debt ratios going through this cycle. And if there is eventually a slow down is it, I mean, the capital ratio using net asset value do you look at 30% level or 40% level of debt to capital ratios. How do you look at that over the cycle? Aristides Pittas: Yes. I mean we look at -- Tasos? Tasos Aslidis: No, no. I was about to show you. I believe the same thing as you were start -- you saying that, we have a current leverage ratio for just around 25% using charter adjusted values. We intend to finance our newbuildings around 60% to 65% of their contract value. So even with the newbuildings finance, our leverage ratio will not be -- will be below around 35%. So, it's a moderate leverage ratio reflective of the point in the cycle we are even if there is a movement, downward movement of the cycle will remain very low levels that we're quite comfortable to serve throughout the cycle. Tate Sullivan: Tank you. And last for me just following up the newbuild comment if you did order a ship today just in terms of the update, I know it can vary. if its 2000, middle 2024 delivery at this point? Aristides Pittas: Around that update, yes. Tate Sullivan: Okay. Okay. Thank you both. Have a great rest of the day. Aristides Pittas: Thank you. Operator: We will now take our next question. Please go ahead. Your line is now open. Poe Fratt : Hi. This is Poe Fratt from Noble Capital Markets. Good afternoon to both of you. Just to follow up on the newbuild question. It looks like between the time that you ordered the first two and then move forward on the second two, I was a little bit surprised that you were able to minimize the price increases. It would -- the price only went up for the newbuilds about 15%. And can you just talk about whether you had options for the second two newbuilds or whether these were just new negotiations with the shipyard and you were able to minimize the cost increases? Aristides Pittas: They were new negotiations, Poe. They were new negotiations. We didn't, we weren't able to get options. The ship charts are very difficult to give options these days unfortunately, because they know that there is -- it's tight to order newbuild vessels. There's quite a lot of inquiry. Not too many shipyards around to build ships, so they have a bargaining power these days. The reason is that the price increase was not that high is that the delivery time is quite some time out, right? The deliveries are towards the end of 2023 and beginning of 2024. While the first two vessels have deliveries at the beginning of 2023 first and second quarter 2023. So it's not only that the price is more expensive, not too much luckily, but it's also six months later deliveries as well. Poe Fratt : Yes. But that's measure with the time between when you ordered the first and second, isn't it? Aristides Pittas: True. It is. But if we were able to get an early delivery, it would be -- have been much more expensive. Poe Fratt : Okay, understood. And so, when you're looking at, I think you talked about the earliest to get another two potentially newbuilds out there. Would you be looking at a like increase in costs, say, closer to a $100 million for two instead of $86 million or sort of have you ever gone --. Aristides Pittas: I don't want to speculate too much when the discussions might be going on. But if there is something to announce we'll definitely announce it. But I leave it that right now, Poe. Poe Fratt : Okay. I appreciate that. Could you talk about -- I think in your last webcast or webinar, I thought I heard or maybe it was on the last quarterly conference call, I thought I heard that there was interest in the first two newbuilds as far as putting them under time charters. Can you update us on any potential time charters that you might have secured or in the potential or process of securing on the ? Aristides Pittas: Be sure that if there is something to be announced there will be a press release announcing it. So there is nothing announceable at this point in time. People are showing some interest in fixing, but still, we are not actively marketing the ships for charter. We think it's something that might happen within the next few months, but we're not actively marketing them yet. Poe Fratt : Okay, great. And then, could you talk about the -- as somebody mentioned you just don't have that much availability this year as far as new time charters. But could you talk about the open days that you have either on the Akinada Bridge or the, now I forget, what the second one is, it's closer. Is there any change in the market that would lead us to believe that you wouldn't be able to get similar terms as far as time charter length and rates on those two open vessels? Aristides Pittas: The context index just came out today as it comes twice a week. All constituents were green again, which means, they were all up again a little bit. So the market continues to strengthen. So we think that the more we wait the higher we can probably still fix. I don't know if this will continue forever. It can't obviously, but it continues. So we'll see. Poe Fratt : And would you be looking for more length Euroseas or given the current forward cover you have, would you be more inclined to play more the short term and keep some of those open or exposed to the spot market? Aristides Pittas: No. It will depend on what interest we see from our clients. We are happy with the levels that we are seeing for long periods as well. So if we see for the small years we might do the three years for the . For the bigger vessel we would do anything from three to five years, if the rate for a single year was fantastic, we could consider that as well. We will see. We will see. Poe Fratt : Yep. Stay tuned. And then can we just walk through sort of your philosophy on potentially doing either stock buybacks or dividends, whether it's a special dividend or regular dividend. If I do the math on the next two years 2022 and 2023, I come to the conclusion that you, from an operating cash flow standpoint you'll generate more than $250 million based on what the current market and current forward cover is. And you have from a cash perspective about $65 million of CapEx on the newbuild program assuming that you're going to finance 60% the final delivery payments on the newbuilds. And so, you'll generate a significant amount of excess cash if you will. And unless you make additional acquisitions, can you just talk about what potential plans you might have for assessing what you do with the excess cash? Aristides Pittas: Yes. As you have seen our first priority has continued to be -- to use the liquidity that we generate to grow the company and to renew the fleet and position the company to be an even more significant player within the segment that we are active. So this is the top priority, if we can find projects that make sense. So this is the most interesting thing for us. If we run out of investment ideas then we might consider returning capital to shareholders. However, up to now we've been able to find good opportunities to invest. And I think that every investment that we've done up to now already appears that it has been a good investment and is an investment which is returning significant additional value to the shareholders. So, up to now, we've been able to find good investments. I hope we will continue to be able to do that. If we feel that we can't do it, then obviously we will have to do something with the liquidity that we will be making that will benefit our shareholders. As I've said repeatedly. Our family is one of the major shareholders within the company and our priorities to optimize the results. Poe Fratt : Okay, great. And if I could just ask one last question about just the cadence of the capital that you're going to spend on the newbuilds. You have $7.6 million so far the deposits on the first two newbuilds. I still assume there'll be 10% deposits on the second two newbuilds this coming quarter maybe the second quarter. Can you -- my math brings me to about $34 million of CapEx in 2022 for the newbuilds. And then about $98 million in the -- for the new builds in 2023? Are those numbers in the ballpark or can you give us an idea of how much CapEx you'll have for the newbuild program in 2022 and 2023? Tasos Aslidis: I think those numbers are in the ballpark. I would expect that we will make about six installments for the first two newbuilds by the end of the year. We have made two and we'll make another four I guess. And then, we'll pay the remaining delivery, 70% delivery And we'll start making installments for the for the newbuildings. I would imagine that we'll do one, obviously, the first 10%, we have done that. And I think the rest one, the rest of them will be in 2023. Poe Fratt : Okay, great. Thank you so much. Tasos Aslidis: Yep. And the last one. And the fourth one will be in 2024, the 70% of the fourth one. Poe Fratt : Yes. That applet in the first quarter of 2024. Okay, great. Thank you Tasos. Tasos Aslidis: Okay. Tasos Aslidis: Thank you, Poe. Aristides Pittas: Okay, guys. Operator: We have no further questions at this time. Aristides Pittas: Okay. Thank you very much for being with us during this call. And we look forward to talking to you in the three months time. Thank you. Tasos Aslidis: Thank you everybody. Operator: That concludes the conference for today. Thank you for participating. You may all disconnect,
Euroseas Ltd. (NASDAQ:ESEA) Set to Release Q2 2025 Financial Results
- Euroseas Ltd. (NASDAQ:ESEA) is expected to report an EPS of $3.87 and revenue of $54.67 million for the second quarter of 2025.
- The company's price-to-earnings (P/E) ratio is 2.68, indicating a potentially undervalued stock with a high earnings yield of 37.33%.
- ESEA's financial health is highlighted by a current ratio of 1.74 and a debt-to-equity ratio of 0.64, suggesting a good liquidity position and manageable debt levels.
Euroseas Ltd. (NASDAQ:ESEA), a Greek company specializing in the operation of container carrier vessels, is gearing up to announce its financial results for the second quarter of 2025 on August 13, 2025, before the New York market opens. A conference call and webcast will follow to discuss these results in detail. Analysts are setting their expectations high, with an anticipated earnings per share (EPS) of $3.87 and projected revenue of approximately $54.67 million.
The financial metrics of ESEA offer a deep dive into its market valuation and overall performance. With a price-to-earnings (P/E) ratio of 2.68, the company presents a compelling case for being undervalued, especially when considering its impressive earnings yield of 37.33%. This high yield suggests that investors could enjoy a significant return on earnings relative to the share price.
Investors are currently paying $1.57 for every dollar of sales, as indicated by ESEA's price-to-sales ratio of 1.57. This is further complemented by an enterprise value to sales ratio of 2.26, showcasing the company's efficiency in generating sales relative to its market valuation. Moreover, the enterprise value to operating cash flow ratio stands at approximately 3.49, a testament to the company's ability to generate cash flow in relation to its valuation. The debt-to-equity ratio of 0.64 portrays a moderate level of debt, which is considered manageable.
The liquidity position of ESEA is solid, with a current ratio of 1.74, indicating the company's capability to cover its short-term liabilities. As Euroseas Ltd. prepares to unveil its quarterly earnings, these financial metrics offer a comprehensive snapshot of its market stance and fiscal health, painting a picture of a company that is potentially undervalued and in a strong financial position.
Euroseas Ltd. (NASDAQ:ESEA) Quarterly Earnings Preview
- Euroseas Ltd. (NASDAQ:ESEA) is set to release its quarterly earnings with an estimated EPS of $3.87 and projected revenue of $54.67 million.
- The company's valuation metrics such as a P/E ratio of 2.76 and a price-to-sales ratio of 1.62 suggest an attractive valuation in the market.
- Financial ratios like a debt-to-equity ratio of 0.64 and a current ratio of 1.74 indicate a moderate level of debt and good liquidity.
Euroseas Ltd. (NASDAQ:ESEA), a prominent shipping company specializing in the transportation of dry bulk and containerized cargoes, competes within the maritime industry against firms like Danaos Corporation and Costamare Inc. The company is eagerly anticipated to release its quarterly earnings on Tuesday, August 5, 2025. Wall Street analysts have set the earnings per share (EPS) estimate at $3.87 with projected revenue of approximately $54.67 million.
Despite these projections, there is an anticipation of a decline in earnings for the second quarter of 2025, primarily due to lower revenues, as highlighted by the Zacks Consensus Estimate. The company's stock price could be influenced by how the actual earnings compare to these estimates. If Euroseas surpasses expectations, the stock might see an upward movement. Conversely, if the earnings fall short, the stock could decline.
ESEA's financial metrics provide insight into its current valuation. The company has a price-to-earnings (P/E) ratio of approximately 2.76, indicating a relatively low valuation compared to its earnings. Additionally, the price-to-sales ratio stands at about 1.62, suggesting that investors are paying $1.62 for every dollar of sales. These figures suggest that ESEA is valued attractively in the market.
The enterprise value to sales ratio is around 2.31, reflecting the company's total valuation in relation to its sales. The enterprise value to operating cash flow ratio is approximately 3.56, indicating how many times the operating cash flow can cover the enterprise value. With an earnings yield of 36.23%, ESEA offers a substantial return on investment relative to its share price.
ESEA's debt-to-equity ratio is 0.64, showing a moderate level of debt compared to equity. This suggests that the company is managing its debt well. Lastly, the current ratio is 1.74, indicating that ESEA has a good level of liquidity to cover its short-term liabilities. The upcoming earnings call will be crucial, as management's discussion on business conditions will play a significant role in determining the sustainability of any immediate price changes and future earnings expectations.
Euroseas Ltd. (NASDAQ:ESEA) Surpasses Earnings and Revenue Expectations
- Euroseas Ltd. (NASDAQ:ESEA) reported earnings per share of $3.87, exceeding estimates and showcasing strong financial performance.
- The company's revenue of $54.73 million surpassed expectations, indicating effective navigation of industry challenges.
- ESEA's low price-to-earnings (P/E) ratio of approximately 2.68 and price-to-sales ratio of about 1.42 highlight its attractiveness as an investment.
Euroseas Ltd. (NASDAQ:ESEA) is a prominent player in the container shipping industry, known for its robust financial performance and strategic growth initiatives. On June 12, 2025, ESEA reported impressive earnings per share of $3.87, surpassing the estimated $3.35. The company also exceeded revenue expectations, reporting $54.73 million against an estimated $53.83 million. This strong performance underscores ESEA's ability to navigate industry challenges effectively.
ESEA's recent achievements have positioned it among the top-rated transportation stocks, reaching new 52-week highs in June. This success is partly due to its attractive dividends, which appeal to investors seeking stable returns. The stock's potential for further growth is evident, with Wall Street analysts predicting a 32.3% surge in its stock price. Over the past four weeks, ESEA shares have already increased by 15.2%, closing at $40.58.
Despite challenges in the Zacks Transportation - Shipping industry, such as high inflation and supply-chain disruptions, ESEA demonstrates resilience. The company's low price-to-earnings (P/E) ratio of approximately 2.68 indicates a relatively low valuation compared to its earnings, making it an attractive investment. Additionally, ESEA's price-to-sales ratio of about 1.42 suggests that investors are paying $1.42 for every dollar of sales, highlighting its value proposition.
ESEA's financial metrics further emphasize its strong position. The enterprise value to sales ratio is around 2.04, while the enterprise value to operating cash flow ratio is approximately 3.39, reflecting the company's valuation in relation to its cash flow. With an earnings yield of about 37.33%, ESEA offers significant potential returns for investors. The company's debt-to-equity ratio of approximately 0.57 indicates a moderate level of debt, while a current ratio of about 1.48 shows good liquidity to cover short-term liabilities.
In the broader transportation sector, Copa Holdings, an airline operator, also stands out for its impressive performance. Copa Airlines, based in Panama City, has capitalized on increased travel demand post-pandemic, maintaining operating margins of over 20%. This positions Copa as one of the most profitable airlines globally, surpassing many Latin American counterparts. Both Euroseas and Copa Holdings benefit from the stock market's historic rebound, making them noteworthy investments in the transportation sector.

Euroseas Limited (NASDAQ:ESEA) Quarterly Earnings Preview
- Euroseas Limited (NASDAQ:ESEA) is anticipated to report an EPS of $3.35 and revenue of $53.8 million for the upcoming quarter.
- The company has achieved new 52-week highs, reflecting its strong market position and attractive dividend offerings.
- Despite challenges in the transportation sector, ESEA shows resilience with a positive outlook from Wall Street analysts, predicting a potential 32.3% surge in its stock price.
Euroseas Limited (NASDAQ:ESEA), a prominent player in the transportation sector, particularly in container shipping, is gearing up for its quarterly earnings release on June 12, 2025. Wall Street analysts have set their expectations with an estimated earnings per share (EPS) of $3.35 and projected revenue of approximately $53.8 million. ESEA's performance is under the spotlight due to its pivotal role in the industry.
ESEA has recently marked new 52-week highs, underscoring its robust market stance. This milestone is bolstered by the company's appealing dividend offerings, anticipated to persist. The broader transportation sector, including ESEA, is benefiting from a market rally propelled by economic recovery. ESEA, along with Copa Holdings, is acknowledged for its solid performance and potential for elevated returns.
Despite facing challenges such as high inflation and supply-chain disruptions, the Zacks Transportation - Shipping industry demonstrates resilience. ESEA, FLEX LNG Ltd., and KNOT Offshore Partners stand out in this sector. They adeptly navigate these hurdles, offering marine transportation services through long-term contracts. These companies are recommended for investment due to their growth prospects and operational efficiency.
Wall Street analysts maintain a positive outlook on ESEA, forecasting a potential 32.3% increase in its stock price. Over the past four weeks, ESEA shares have risen by 15.2%, closing at $40.58. Analysts have established a mean price target of $53.67, with estimates ranging from $44 to $60. The standard deviation of $8.50 among these estimates suggests variability in predictions, with a smaller deviation indicating greater consensus.
ESEA's financial metrics underscore its robust valuation. The company boasts a price-to-earnings (P/E) ratio of 2.55, a price-to-sales ratio of 1.36, and an enterprise value to sales ratio of 1.97. Its earnings yield stands at 39.17%, and the debt-to-equity ratio is 0.57, indicating moderate debt levels. The current ratio of 1.48 suggests good liquidity, enabling ESEA to effectively cover short-term liabilities.

Euroseas Ltd. (NASDAQ:ESEA) Surpasses Revenue Expectations Despite Lower EPS
- Euroseas Ltd. (NASDAQ:ESEA) reported earnings per share (EPS) of $2.64, missing the expected $3.41 but surpassed revenue expectations with $54.7 million.
- The company announced a new time charter contract for M/V Emmanuel P at a daily rate of $38,000, expected to commence after upgrades in September 2025.
- ESEA's financial metrics indicate a low valuation with a P/E ratio of 2.43 and an earnings yield of 41.10%, suggesting the stock is relatively inexpensive.
Euroseas Ltd. (NASDAQ:ESEA) is a key player in the shipping industry, specializing in the ownership and operation of container carrier vessels. The company recently reported earnings per share (EPS) of $2.64 on June 5, 2025, which was below the expected $3.41. Despite this, ESEA surpassed revenue expectations, reporting $54.7 million against the estimated $53.9 million.
A significant development for ESEA is the new time charter contract for its 4,250 TEU intermediate containership, M/V Emmanuel P. This contract, lasting between 36 to 38 months, is set at a gross daily rate of $38,000. The charter is expected to commence after the vessel's drydock and installation of energy-saving devices, scheduled for completion by September 2025.
ESEA's financial metrics reveal a low valuation with a price-to-earnings (P/E) ratio of 2.43, indicating that the stock is relatively inexpensive compared to its earnings. The price-to-sales ratio of 1.29 suggests that investors are paying $1.29 for every dollar of sales, while the enterprise value to sales ratio of 1.91 reflects the company's total valuation in relation to its sales.
The company's enterprise value to operating cash flow ratio is 3.17, showing that the operating cash flow can cover the enterprise value multiple times. ESEA's earnings yield stands at 41.10%, offering a substantial return on its earnings relative to its share price. The debt-to-equity ratio of 0.57 indicates a moderate level of debt compared to equity, while a current ratio of 1.48 suggests good liquidity to cover short-term liabilities.
Euroseas Ltd. Q1 2024 Financial Performance Review
- Euroseas Ltd. reported an EPS of $2.87 for Q1 2024, missing the anticipated $3.02 but showcasing strong revenue growth.
- The company's revenue for the quarter was $46.72 million, surpassing the forecasted $46.31 million and indicating robust financial health.
- EBITDA stood at approximately $25.83 million, highlighting Euroseas' operational efficiency and ability to navigate market challenges effectively.
Euroseas Ltd. (NASDAQ:ESEA), a notable entity within the Zacks Transportation and Shipping industry, recently disclosed its financial outcomes for the first quarter of 2024. On Thursday, May 23, 2024, the company reported an earnings per share (EPS) of $2.87, which did not meet the anticipated $3.02. Despite this, ESEA's revenue performance was a silver lining, as it surpassed expectations by reaching approximately $46.72 million against the forecasted $46.31 million.
During the Q1 2024 earnings conference call, key figures such as Aristides Pittas, the Chairman and CEO, and Tasos Aslidis, the CFO, provided insights into the company's financial health and strategic direction. The presence of analysts like Tate Sullivan from Maxim Group and Kristoffer Skeie from Arctic Securities underscored the keen interest in Euroseas' performance and future prospects. This event was a pivotal moment for the company to discuss its achievements and outline its plans moving forward.
Despite the EPS falling short of expectations, Euroseas demonstrated commendable revenue growth, reporting $48.3 million for the quarter ending March 2024. This figure not only exceeded the Zacks Consensus Estimate by 0.40% but also marked an improvement from the $43.46 million reported in the same period the previous year. Such consistent revenue growth, especially in an industry as volatile as shipping, highlights Euroseas' ability to navigate market challenges effectively.
The company's financial health is further evidenced by its net income of around $20 million for the quarter, with a gross profit of approximately $23.22 million. Operating income reached nearly $20.39 million, and EBITDA was reported at about $25.83 million. These figures, particularly the EBITDA, which stands for Earnings Before Interest, Taxes, Depreciation, and Amortization, provide a clearer picture of the company's operational performance by excluding the costs that can obscure how the business is actually doing.
Euroseas' ability to exceed consensus revenue estimates in three of the last four quarters, despite the earnings miss, suggests a strong underlying business model and operational efficiency. The detailed financial metrics, such as the cost of revenue at about $23.49 million and the negligible income tax expense, further reinforce the company's solid financial standing. As Euroseas continues to navigate the complexities of the shipping industry, its financial results serve as a testament to its resilience and strategic acumen.


