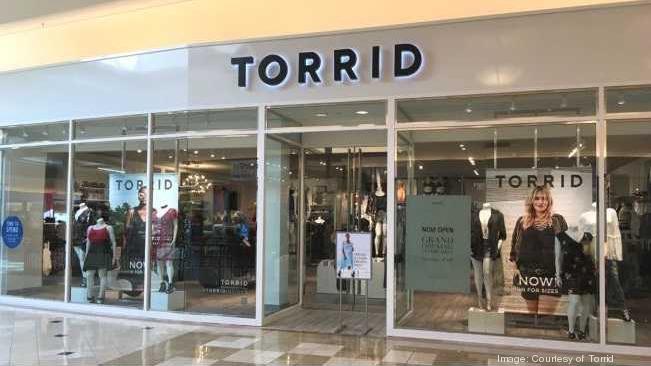
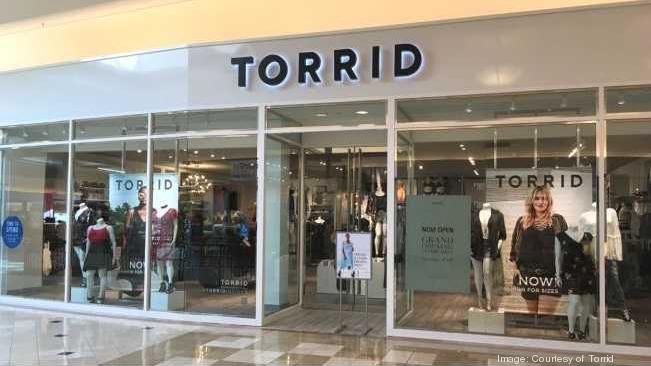
Torrid Holdings Inc. Surpasses Earnings Expectations

- Torrid Holdings Inc. eported an EPS of $0.1157, beating estimates, but saw a slight miss in revenue projections.
- The company achieved a higher-than-expected Adjusted EBITDA and an improvement in gross profit margin to 41.3%.
- Valuation metrics such as P/E ratio and P/S ratio provide insights, but a current ratio of 0.83 suggests potential liquidity challenges.
On Wednesday, June 12, 2024, Torrid Holdings Inc. (NYSE:CURV), a prominent player in the women's apparel retail sector, reported its earnings after the market closed. The company announced an earnings per share (EPS) of $0.1157, surpassing the estimated EPS of $0.07. Despite this positive earnings surprise, CURV's revenue for the quarter was slightly below expectations at approximately $279.77 million, missing the estimated $280.53 million. This financial performance was discussed in detail during CURV's first quarter fiscal 2024 earnings conference call, which featured key company participants and analysts from notable financial institutions.
Torrid Holdings, headquartered in the City of Industry, California, specializes in direct-to-consumer apparel, intimates, and accessories for women sizes 10 to 30. The company's CEO, Lisa Harper, highlighted the achievement of higher-than-expected Adjusted EBITDA, attributing this success to significant gross margin expansion and strict inventory control. Despite a net sales decrease of 4.8% compared to the same quarter of the previous year, the company saw an improvement in gross profit margin, rising to 41.3% from 37.7%. This indicates effective management strategies and customer engagement efforts that have positively impacted the company's financial health.
The earnings call, as detailed by Seeking Alpha, was an opportunity for Torrid Holdings to discuss its performance and strategic direction. The presence of high-profile analysts and company executives underscores the importance of this earnings call in communicating the company's financial health and future prospects to investors and stakeholders. The company's ability to exceed earnings expectations but fall slightly short on revenue projections presents a mixed financial picture that investors need to consider.
CURV's valuation metrics, such as the price-to-earnings (P/E) ratio of approximately 57.43 and the price-to-sales (P/S) ratio of about 0.61, provide insights into how the market values the company relative to its earnings and sales. The enterprise value to sales (EV/Sales) ratio of roughly 0.76 and the enterprise value to operating cash flow (EV/OCF) ratio of approximately 14.67 further highlight the company's valuation in terms of its sales and operating cash flow. Despite these figures, CURV's current ratio of about 0.83 indicates potential challenges in covering short-term liabilities with its current assets, a factor that investors should consider when evaluating the company's financial stability.
In summary, Torrid Holdings Inc. has demonstrated a capacity to exceed earnings expectations, reflecting its effective management and strategic initiatives. However, the slight shortfall in revenue and the mixed signals from various valuation metrics suggest that investors should closely monitor the company's performance and strategic direction moving forward.
| Symbol | Price | %chg |
|---|---|---|
| 9983.T | 47160 | -0.76 |
| TRENT.NS | 5408 | -0.66 |
| TRENT.BO | 5406.2 | 0 |
| BABY.JK | 300 | -0.67 |

Torrid Holdings Inc. (NYSE:CURV) Q3 Earnings Overview
- Torrid Holdings Inc. (NYSE:CURV) reported a Q3 EPS of -$0.0114, missing estimates but showing year-over-year improvement.
- The company's revenue was $263.8 million, below expectations, with a noted shortfall attributed to product assortment challenges.
- Despite financial hurdles, Torrid achieved a 285 basis point increase in gross profit and saw modest growth in Adjusted EBITDA.
Torrid Holdings Inc. (NYSE:CURV), a leading direct-to-consumer apparel brand specializing in women's sizes 10 to 30, recently unveiled its third-quarter earnings for fiscal 2024. The company disclosed an earnings per share (EPS) of -$0.0114, falling short of the anticipated EPS of $0.03. This outcome, however, signifies an improvement from the prior year's loss of $0.03 per share, as emphasized by Zacks Investment Research.
The company's revenue for the quarter stood at approximately $263.8 million, not meeting the expected $289.3 million. CEO Lisa Harper attributed this shortfall to a lack of newness and novelty in their fall assortments. Despite these challenges, Torrid achieved a 285 basis point increase in gross profit and modest growth in Adjusted EBITDA, indicating some positive financial performance.
Torrid's financial metrics paint a mixed picture. The company has a price-to-earnings (P/E) ratio of about 31.47, suggesting investors are willing to pay a premium for each dollar of earnings. However, the price-to-sales ratio of 0.43 indicates a relatively low valuation compared to its sales. The enterprise value to sales ratio is around 0.56, reflecting the company's total valuation in relation to its revenue.
The company's liquidity and debt levels present potential challenges. With a current ratio of approximately 0.89, Torrid may face difficulties in covering short-term obligations. Additionally, the negative debt-to-equity ratio of -1.04 indicates more liabilities than equity, which could impact financial stability. Despite these concerns, Torrid ended the quarter with $44 million in cash, providing some financial cushion.
During the Q3 2024 earnings conference call, attended by analysts from firms like Goldman Sachs and Morgan Stanley, Torrid's leadership expressed optimism about future product assortments. CEO Lisa Harper noted a meaningful change in the business environment from late September into October, suggesting potential improvements in customer responses and sales performance.

Torrid Holdings Inc. (NYSE: CURV) Quarterly Earnings Preview
- Torrid Holdings Inc. (NYSE: CURV) is expected to report an EPS of $0.03 and projected revenue of $284.3 million.
- The stock has experienced a significant increase of 19.1% over the past month, outperforming the broader retail apparel industry.
- Key financial metrics reveal a P/E ratio of 30.32, a price-to-sales ratio of 0.37, and a negative debt-to-equity ratio of -1.77.
Torrid Holdings Inc. (NYSE: CURV) is a leading direct-to-consumer brand in North America, specializing in apparel, intimates, and accessories for women sizes 10 to 30. The company is set to release its quarterly earnings on December 3, 2024, with Wall Street analysts estimating an earnings per share (EPS) of $0.03 and projected revenue of approximately $284.3 million.
CURV has seen a remarkable stock price increase of 19.1% over the past month, significantly outperforming the broader retail apparel industry, which rose by 5.2%. This surge underscores Torrid's strong position in the plus-size fashion market, a segment that remains largely underserved. The company's strategic focus and operational strengths have been key drivers of this momentum.
The market anticipates a year-over-year increase in earnings for CURV, driven by higher revenues for the quarter ending October 2024. Investors are keenly watching to see if the company's actual results will surpass expectations, as this could positively influence the stock's price. A positive earnings surprise could lead to a rise in the stock price, while a miss might result in a decline.
CURV's financial metrics provide insight into its valuation and financial health. The company has a price-to-earnings (P/E) ratio of approximately 30.32, indicating the price investors are willing to pay for each dollar of earnings. Its price-to-sales ratio is about 0.37, suggesting a relatively low valuation compared to its sales. The enterprise value to sales ratio is approximately 0.74, reflecting the company's total valuation in relation to its sales.
Despite a negative debt-to-equity ratio of -1.77, which may indicate a higher level of debt compared to equity, CURV's enterprise value to operating cash flow ratio is around 10.55, showing how many times the operating cash flow can cover the enterprise value. The current ratio is approximately 0.88, suggesting potential challenges in covering short-term liabilities with short-term assets. Investors are advised to consider these factors in their decision-making process.


